Customer Loyalty
Discover why customer loyalty is key to the success of your business, how to gain brand advocates, and how to measure the impact of having loyal customers



Cardlytics Banking Loyalty Index 2026
From loyalty to relevance: Why personalised rewards matter more than ever for UK banks
From loyalty to relevance: Why personalised rewards matter more than ever for UK banks
UK consumers may feel loyal to their bank, but that loyalty is increasingly conditional.
New research from Cardlytics, based on a nationally representative survey of 4,000 UK adults, shows that while most customers are not actively planning to switch, many are open to reassessing where they bank when the value is clear.
Two thirds of consumers (65%) say they feel loyal to their main bank, and 60% say they are unlikely to switch in the next 12 months. But that stability should not be mistaken for permanence. More than half (57%) have switched their main bank account at some point as an adult, and many now spread their money across more than one provider.
The result is a banking market where retention is no longer just about keeping customers from leaving altogether. It is about staying relevant in more of their everyday financial decisions.
Trust and service still matter, but they are now the baseline
When asked what keeps them with their current bank, UK consumers are most likely to cite good customer service (40%), brand trust and reputation (35%), and the quality of mobile or online banking (32%).
These are the foundations of a strong banking relationship. They help explain why customers stay put, particularly older generations. For example, Baby Boomers are significantly more likely to say customer service is a key reason they stay with their bank (50%).
But these factors are increasingly expected. They are essential to retention, but on their own they may be less effective at creating real competitive advantage.
Unlock the full Cardlytics Banking Index 2026
The shift from passive loyalty to active relevance is changing how the UK banks. To read the full analysis on how financial value triggers action, the impact of personalised rewards on 18 to 34 year olds, and why loyalty is no longer exclusive, download the complete report below.
Get the full insights to discover:
- The Switching Triggers: The specific financial incentives driving 25% of Gen Z to reconsider their bank.
- The Personalisation Opportunity: How tailored rewards can increase retention by up to 55% for key demographics.
- The Visibility Challenge: Why 22% of customers are unaware of the rewards their banks already offer.
- Multi-banking Trends: Why customers are spreading their finances and how to capture a greater share of wallet.

UK Loyalty Movement Report: Airline
Airlines: Unpacking the State of Customer Loyalty
Introduction
Previously, Cardlytics defined loyalty as a consumer’s preference for a merchant over its competitors.* We analyzed billions in spending across six industries to measure customer loyalty and spending patterns with both loyal and non-loyal customers.
But customer behavior isn’t fixed—customers shift between loyalty segments over time. Understanding these shifts helps identify churn and informs strategies to nurture relationships and move customers to higher loyalty segments. In our Loyalty Movement Report, we dive into the Airline category to better understand engagement over time by analyzing more than £40B in consumer spend behavior.
Findings:
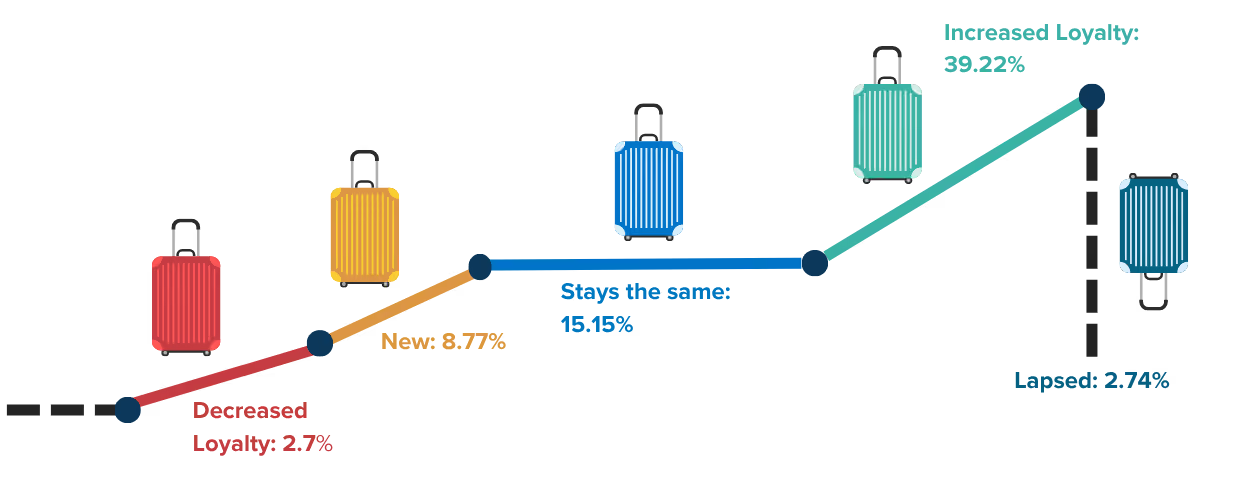
We looked into purchase data at all Airlines in the UK over the last 8 quarters (Q1-23 through Q4-24) on a quarter by quarter basis to see whether even the “most loyal” customers showed changes in their purchase behavior.
Segment Movement
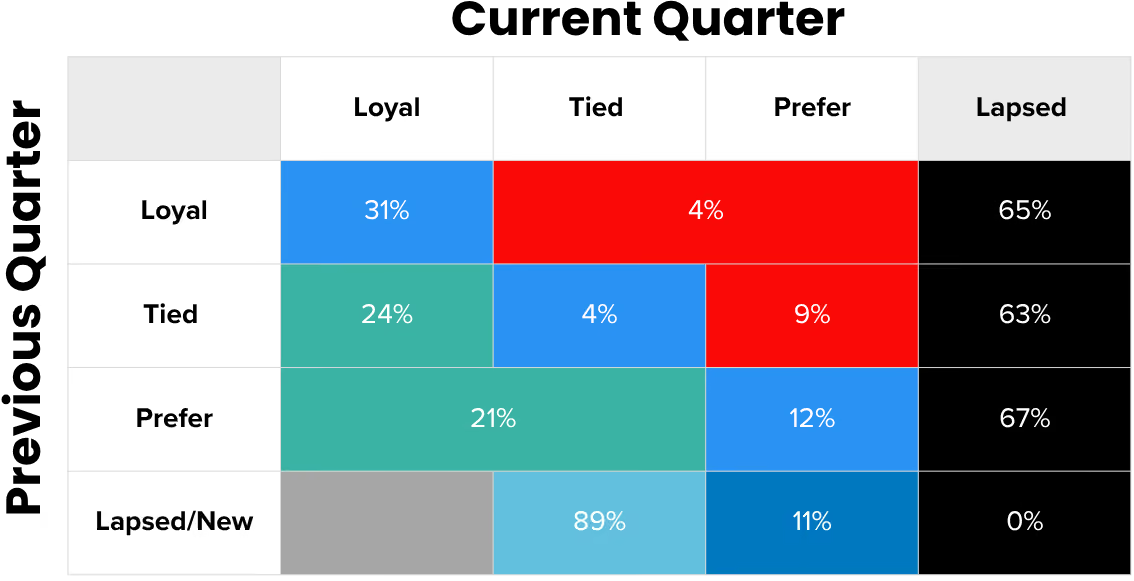
Of the portion of each customer segment that is non-lapsed, those that are loyal to a specific airline show the strongest brand retention - 31% remain loyal quarter over quarter. In contrast, Tied and Prefer customers demonstrate greater variability in behaviour, with only 4% and 12% respectively maintaining their previous preference.
Loyal customers tend to remain consistent in their airline choice, likely driven by the strength of airline loyalty programmes and exclusive incentives. However, Tied and Prefer customers show clear signs of behaviour fluidity, highlighting a key opportunity for targeted campaigns to drive conversion toward brand loyalty.
Lapsed behaviour is high across all segments—65% of previously loyal customers lapsed, and similar rates are observed among Tied (63%) and Prefer (67%) segments. This reflects typical airline purchasing patterns, where customer loyalty can be disrupted by pricing, availability, or external factors, regardless of prior loyalty classification.
Airlines Leaky Bucket
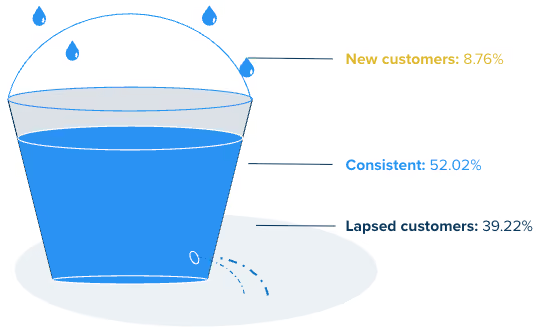
Airlines are acquiring new customers yet even more existing customers are moving into the lapsed tier. This cycle is expected based on typical consumer behavior for airline travel quarter over quarter but reinforces need to nurture existing relationships.
Takeaways:
Airline marketers’ inherent focus on nurturing loyal customers is well-know and consumer spend data show it’s working - Loyal customers tend to stay loyal. But huge opportunity exists with customers who are not loyal to any specific airline and could be lured through greater incentives. To stay top of mind, marketers must continuously nurture relationships, understand customer needs, and offer seamless experiences. To foster loyalty with your customers, consider these recommendations:
- Use an “always on” strategy to keep customers engaged, regardless of purchase frequency.
- Regularly update/refine customer segments and adjust reward offers to keep them engaged.
- Use targeted campaigns to boost loyalty and revenue.
Cardlytics can deliver a comprehensive Customer Loyalty Analysis with insights into customer behavior and movement across defined loyalty segments. Contact us for more details.

Loyalty Movement Report: Apparel
Customer behavior isn’t fixed—customers shift between loyalty segments over time. Understanding these shifts helps identify churn and informs strategies to nurture relationships and move customers to higher loyalty segments. In our Loyalty Movement Report, we dive into customer behavior in the Apparel category to better understand engagement over time by analyzing more than $17B in consumer spend behavior.*
Apparel: Stop Taking Customer Loyalty for Granted
Introduction
In our previous report, Redefining Customer Loyalty, Cardlytics defined loyalty as a consumer’s preference for a merchant over its competitors. We analyzed $160B in spending across six industries to measure customer loyalty and spending patterns with both loyal and non-loyal customers.
But customer behavior isn’t fixed—customers shift between loyalty segments over time. Understanding these shifts helps identify churn and informs strategies to nurture relationships and move customers to higher loyalty segments. In our Loyalty Movement Report, we dive into customer behavior in the Apparel category to better understand engagement over time by analyzing more than $17B in consumer spend behavior.*
Apparel Category Loyal Customers
On average, 61% of a merchant’s customers are not actually loyal. But the loyal segment has a much higher share of wallet (85%) than a not loyal segment (21%).
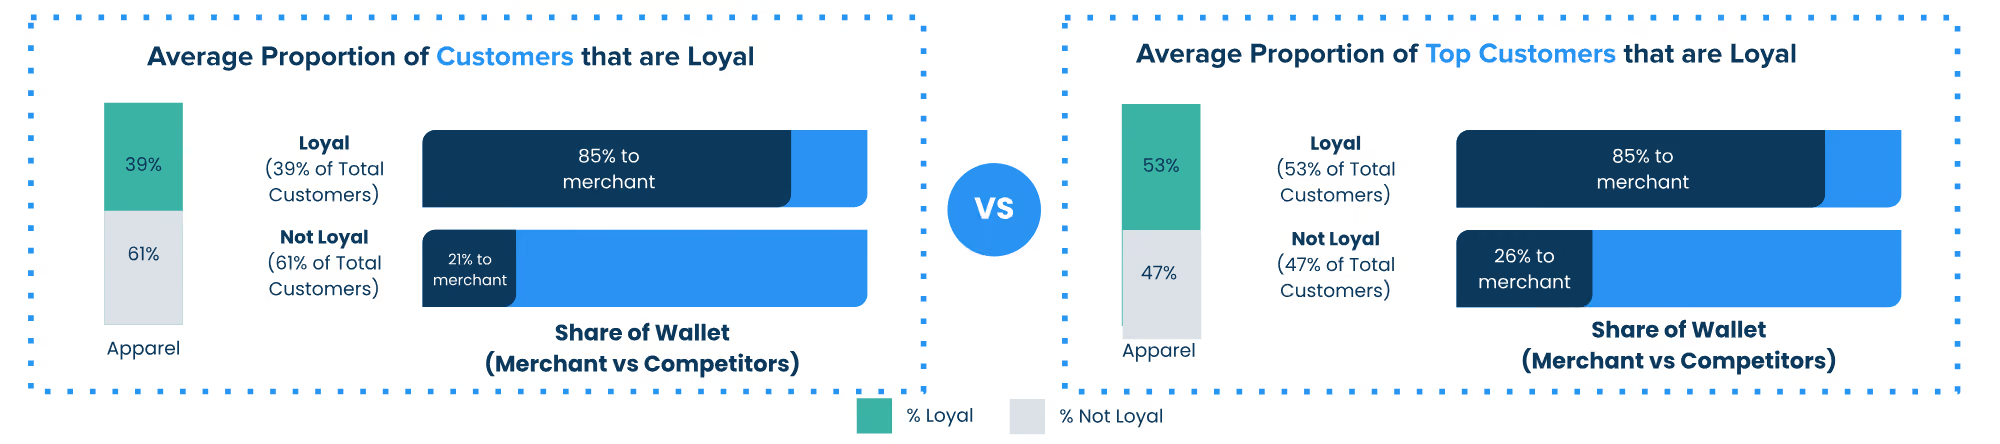
Top Customers (top 10% of most frequent transactors) show a +6 point uptick as loyal vs not loyal customers. But the loyal customer segment shows more than 3x higher share of wallet.
Findings
We looked into purchase data at all Apparel brands in the US over the last 8 quarters (Q1-23 through Q4-24) on a quarter by quarter basis to see whether even the “most loyal” customers showed changes in their purchase behavior.
Apparel Loyalty Movement
Overall, quarter over quarter, 41% of customers tend to remain in their existing segments while 16% increase or decrease their loyalty to a merchant. Yet there is much more extensive customer loyalty movement within the “not loyal” segments.
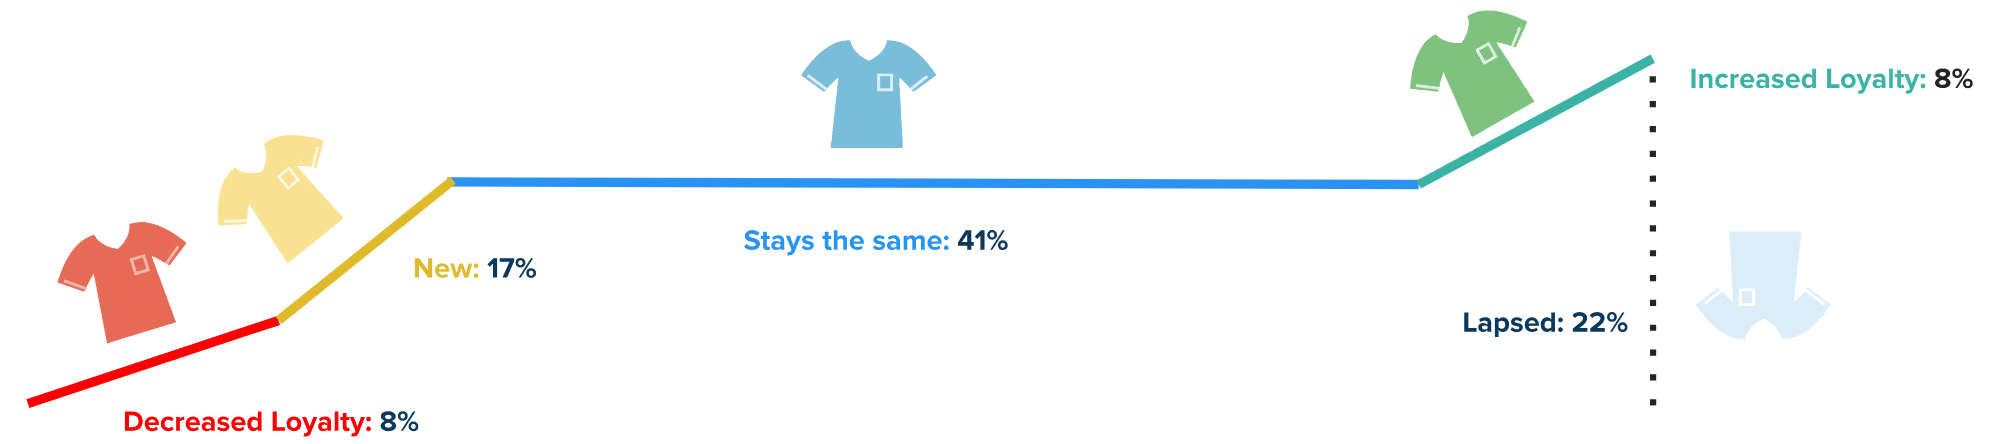
Segment Movement
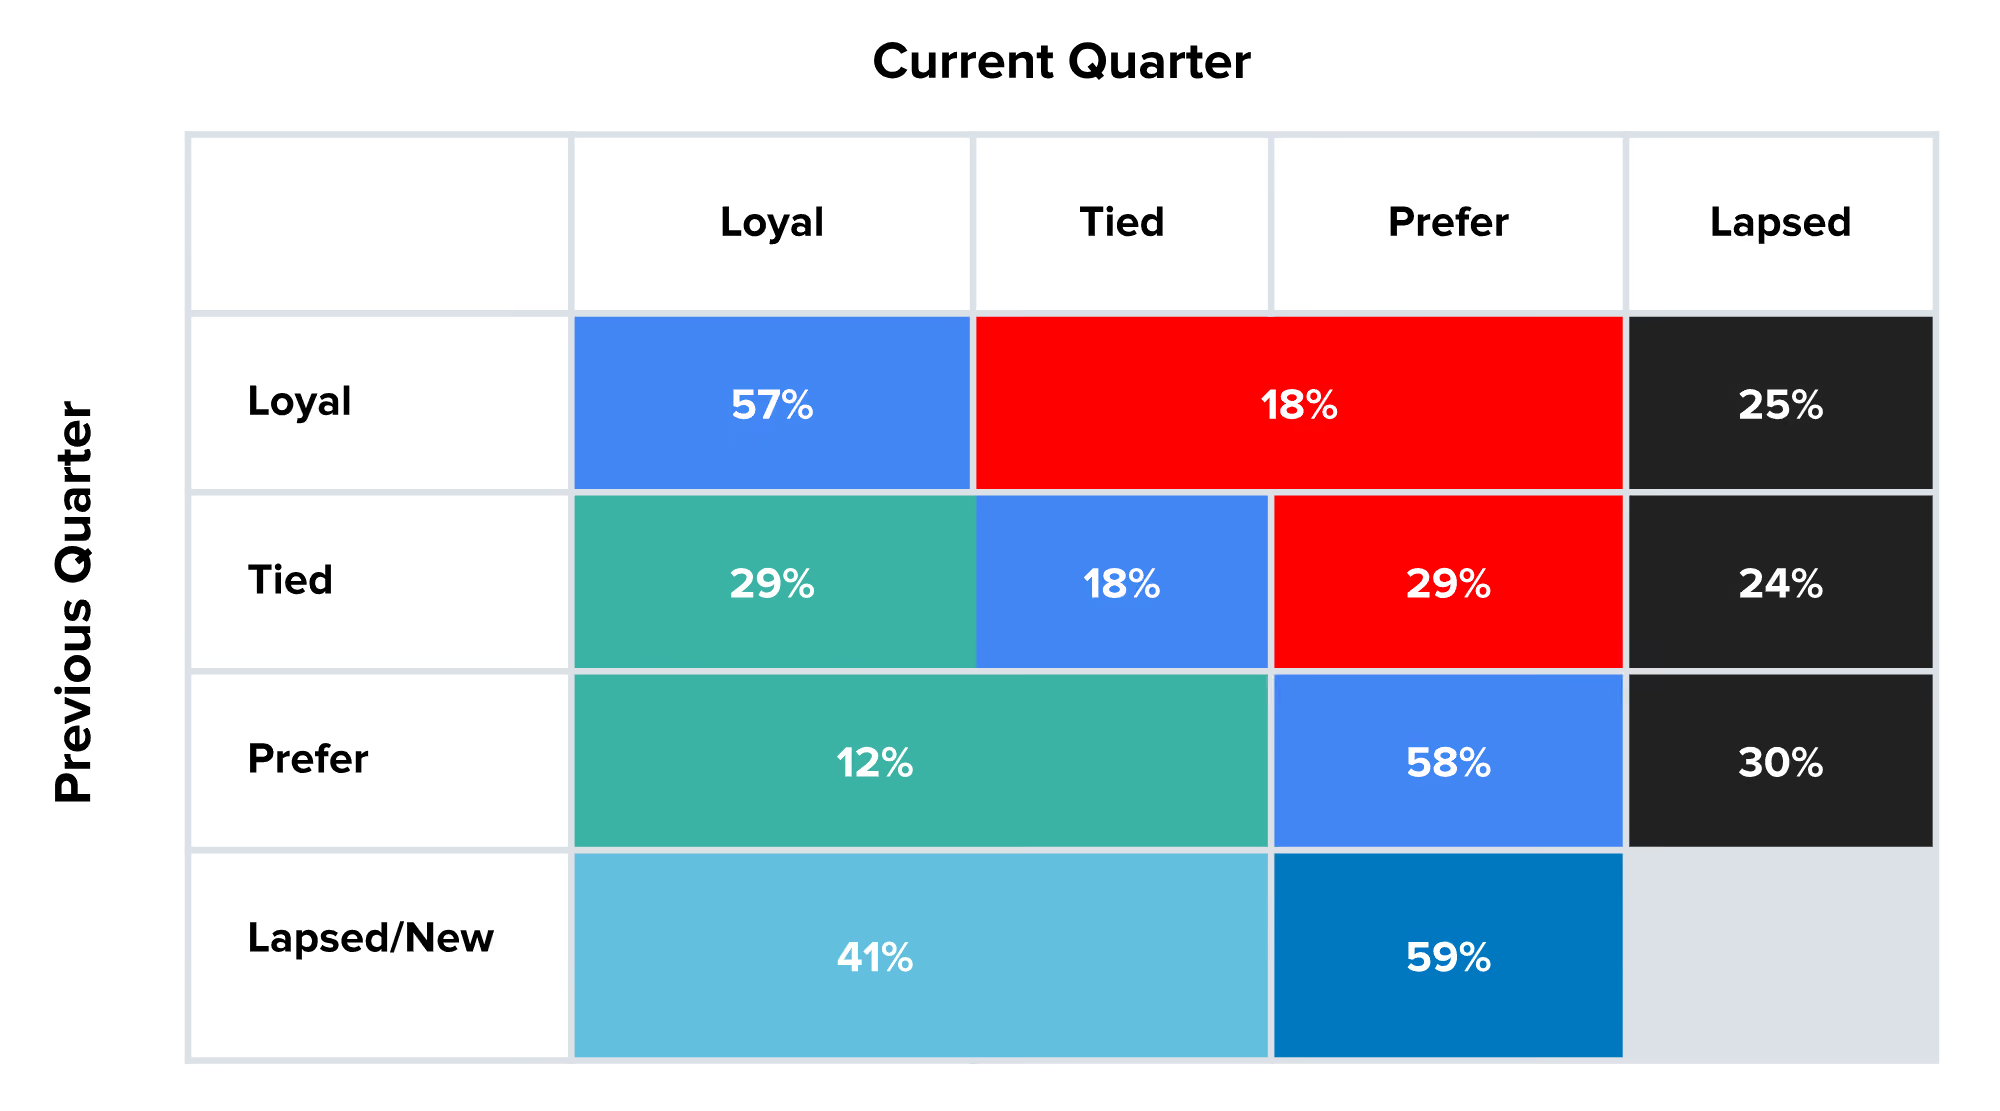
While all segments show purchase behavior movement, the Tied segment (part of Not Loyal customers) shows the most movement - both up (29%) and down (29%) - into other segments.
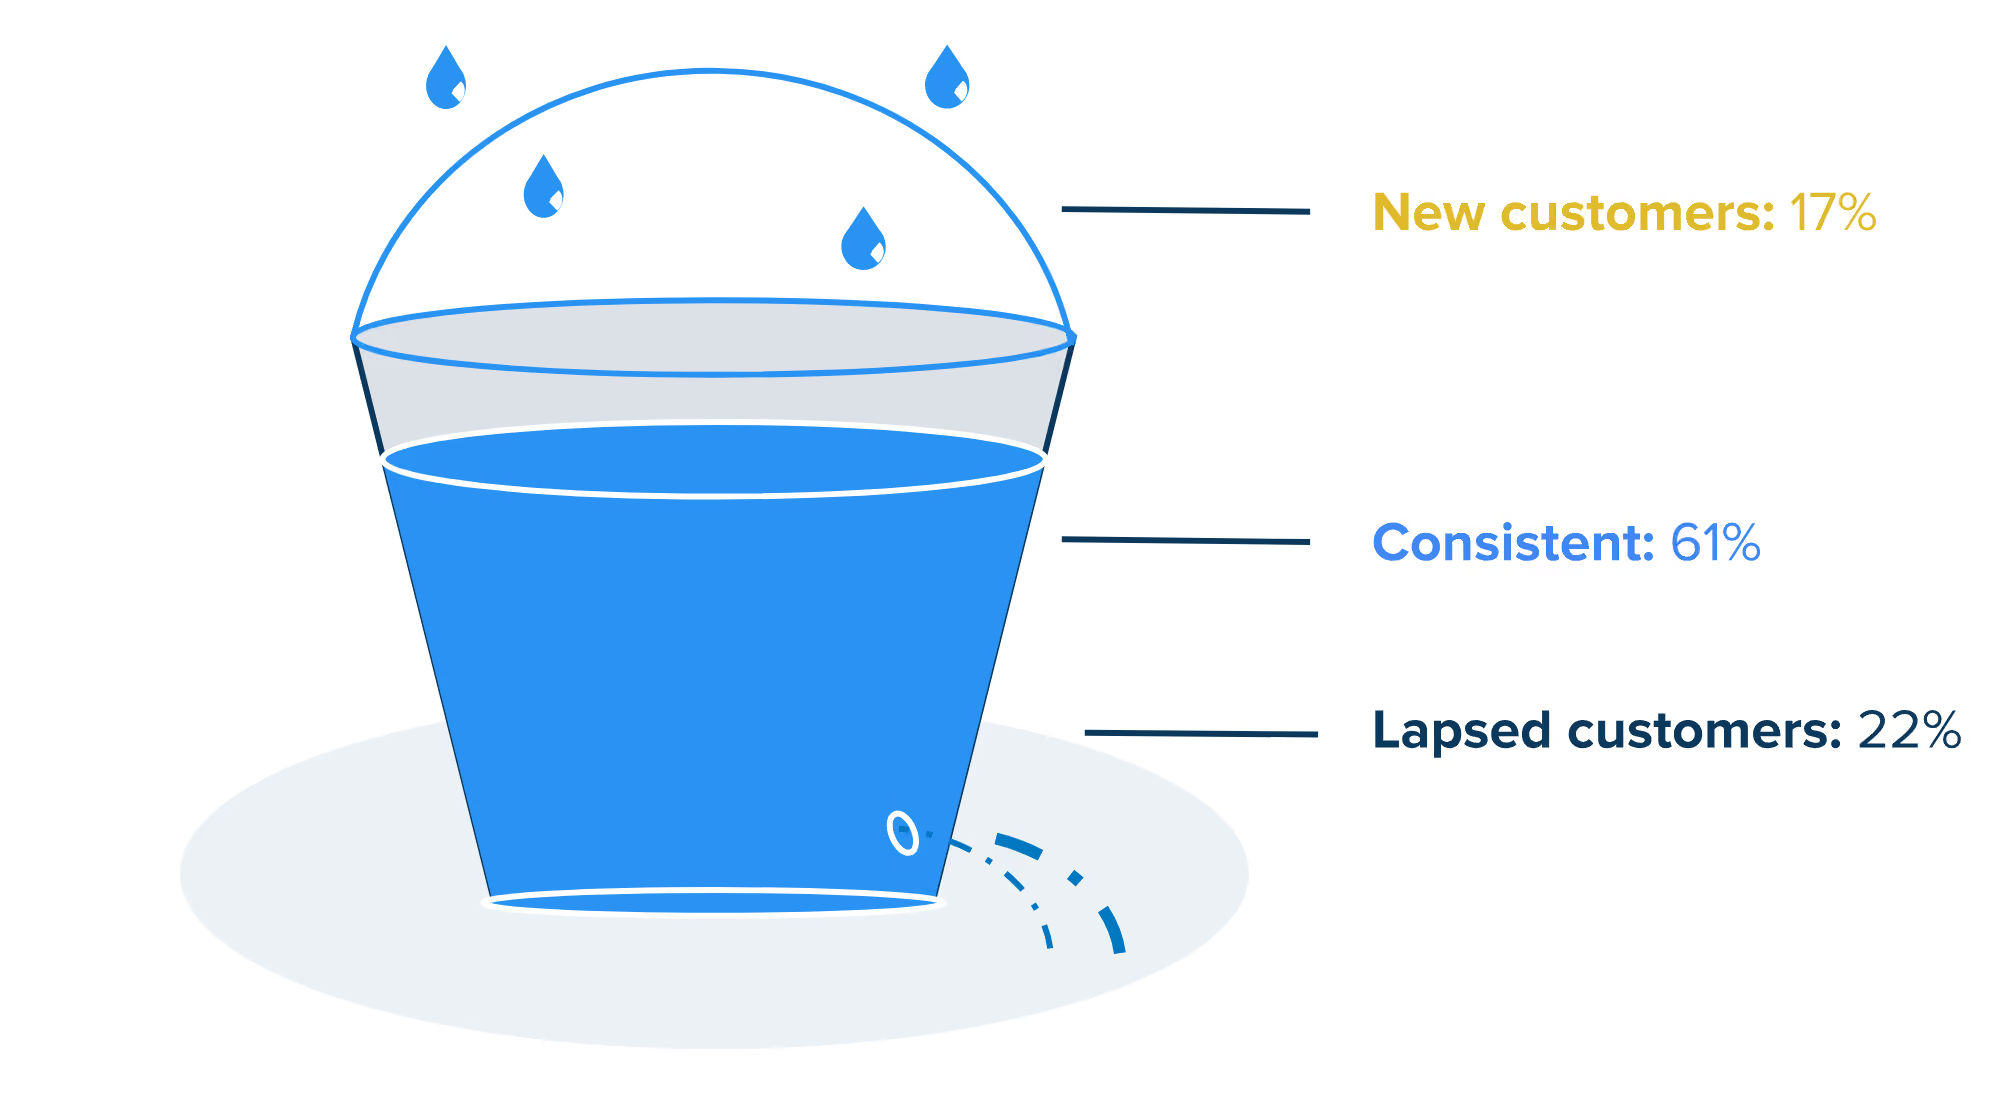
Apparel Leaky Bucket
Apparel brands are acquiring new customers yet even more existing customers are moving into the lapsed tier. This cycle can be reversed by continuing to nurture existing customers.
Diving deeper into the individual segments tells us:
- Loyal customers and those that Prefer the competition are the most rigid (with 57% and 58% staying the same, respectively). Those customers that are Tied have the greatest propensity for a behavior change (with only 18% staying the same).
- While the most Loyal customers show a 25% lapsed rate at similar levels as Tied, this is most likely not connected to churn vs connected to cadence of shopping behavior (maybe they don’t buy clothes every that frequently).
Definitions of Customer Segments
Loyal Customers
Loyal: Only shop with a specific brand, or have the highest share of wallet with a given brand and relative rank is lower than all other brands in consideration set
Not Loyal Customers
Tied: Similar relative ranks to 2 or more brands regardless of share of wallet ranking
Prefer: Lower share of wallet and higher rank than other brands in their consideration set
Lapsed: Shopped historically but do not shop currently, as defined by the analysis time period
New: Shop currently but have not shopped historically, as defined by the analysis time period
Takeaways
Marketers know it’s more costly to acquire or re-acquire customers than to keep existing ones engaged. When brands neglect current customers, they risk losing them and undoing past investment yet the reasons why a customer might “lapse” is different depending upon their loyalty tier. Loyalty is fragile and demands ongoing effort as competition is always close by. To stay top of mind, marketers must continuously nurture relationships, understand customer needs, and offer seamless experiences. To foster loyalty with your customers, consider these recommendations:
- Use an “always on” strategy to keep customers engaged, regardless of purchase frequency.
- Regularly update/refine customer segments and adjust reward offers to keep them engaged.
- Use targeted campaigns to boost loyalty and revenue.
Cardlytics can deliver a comprehensive Customer Loyalty Analysis with insights into customer behavior and movement across defined loyalty segments. Contact us for more details.
* For this report, we've selected the entire Apparel category in our data, collectively representing $17bn in annual card spend. This sample differs from the previous Customer Loyalty Analysis report.
About Cardlytics
Cardlytics (NASDAQ: CDLX) is a commerce media platform, powered by our publishers’ first-party purchase data, that makes commerce smarter and more rewarding for everyone. We offer a range of solutions to help advertisers and publishers, including financial institutions, grow and strengthen customer loyalty. With visibility into approximately half of all card-based transactions in the U.S. and a quarter in the U.K., Cardlytics enables advertisers to engage consumers at scale and drive incremental sales through our industry-leading financial media network. Publisher partners can enhance their platforms with relevant and personalized offers that improve the shopping experience for their customers. Cardlytics also offers identity resolution capabilities through Bridg, which helps convert anonymous shoppers into known and reachable customers. Headquartered in Atlanta, Cardlytics has offices in Menlo Park, Los Angeles, Champaign, New York and London. Learn more at www.cardlytics.com or follow us on LinkedIn.
Loyalty Movement Report: Airlines
Customer behavior isn’t fixed—customers shift between loyalty segments over time. Understanding these shifts helps identify churn and informs strategies to nurture relationships and move customers to higher loyalty segments. In our Loyalty Movement Report, we dive into the Airline category to better understand engagement over time by the entire more than $58B in consumer spend behavior.
Airlines: Unpacking the State of Customer Loyalty
Introduction
In our previous report, Redefining Customer Loyalty, Cardlytics defined loyalty as a consumer’s preference for a merchant over its competitors. We analyzed $160B in spending across six industries to measure customer loyalty and spending patterns with both loyal and non-loyal customers.
But customer behavior isn’t fixed—customers shift between loyalty segments over time. Understanding these shifts helps identify churn and informs strategies to nurture relationships and move customers to higher loyalty segments. In our Loyalty Movement Report, we dive into the Airline category to better understand engagement over time by the entire more than $58B in consumer spend behavior.*
Airline Category Loyal Customers
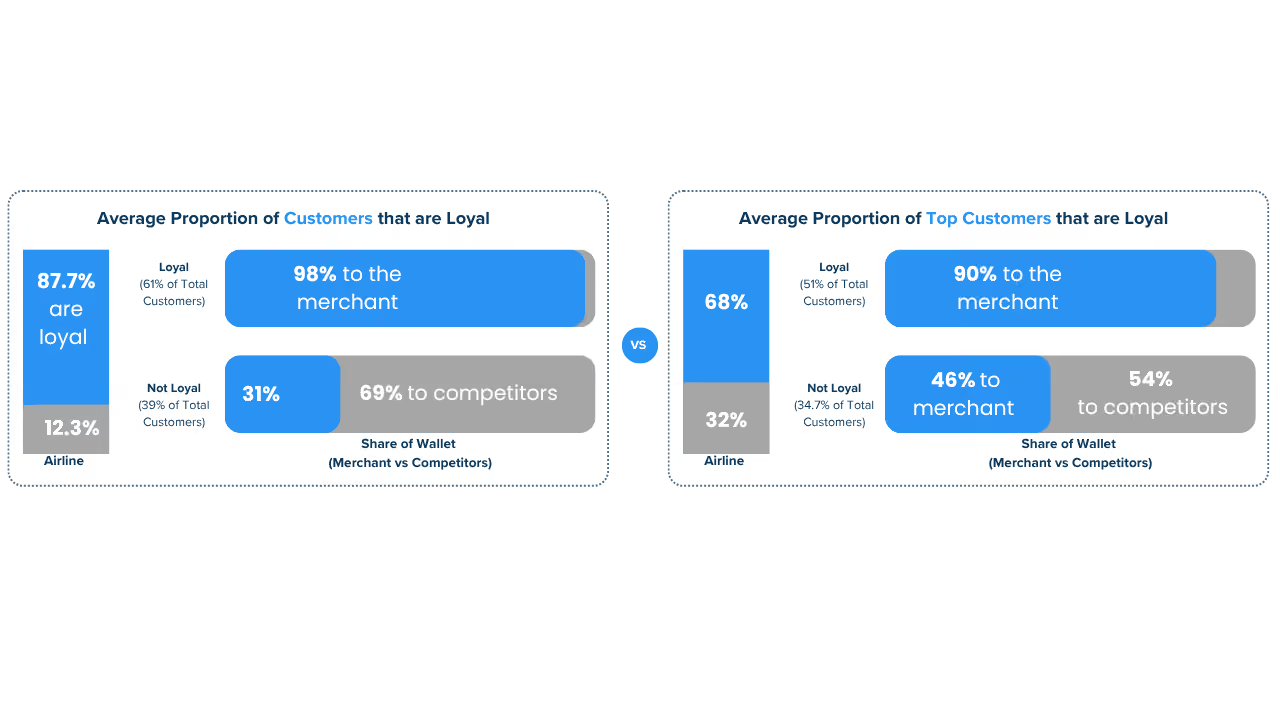
On average, 39% of a merchant’s customers are not loyal. Yet the loyal segment shows extreme loyalty when it comes to share of wallet (95%) where as a not loyal segment does not (28%).
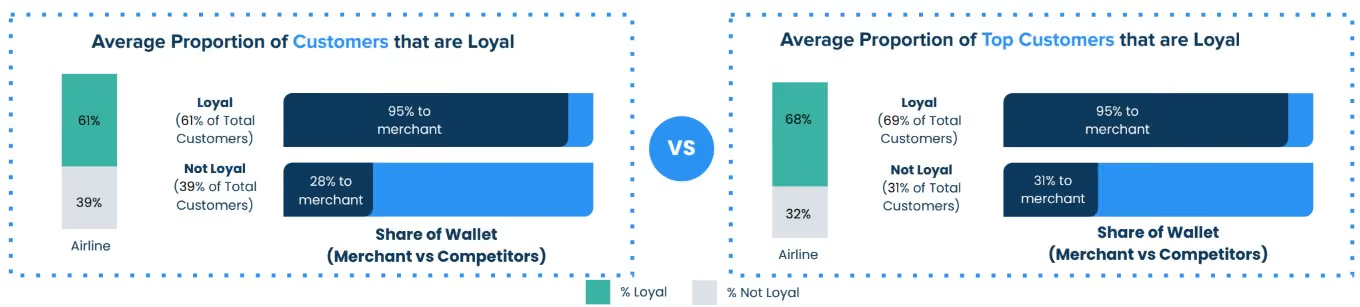
Top Customers (top 10% of most frequent transactors) are heavily loyal - 2/3. And that loyal customer segment shows the same extreme loyalty in terms of share of wallet as all customers.
Findings
We looked into purchase data at all Airlines in the US over the last 8 quarters (Q1-23 through Q4-24) on a quarter by quarter basis to see whether even the “most loyal” customers showed changes in their purchase behavior.
Airline Loyalty Movement
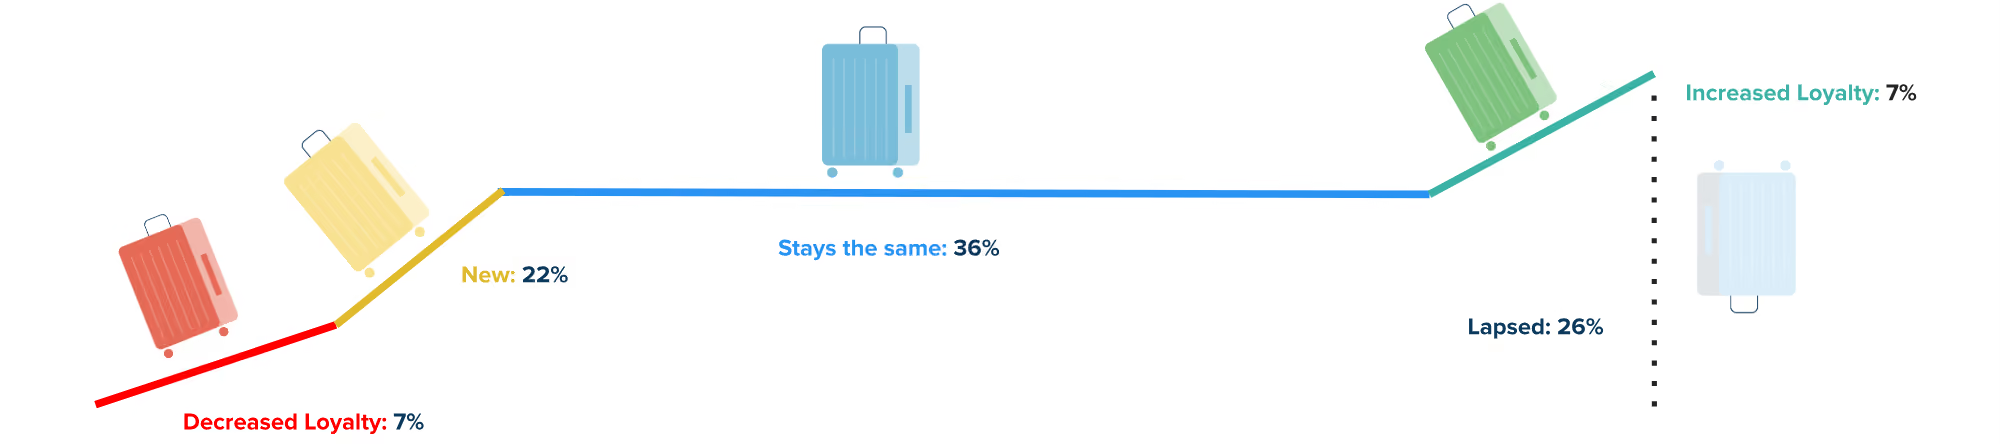
Overall, quarter over quarter, customers tend to stay in their same segment (36%) while there is an equal amount that increase/decrease loyalty (7%) and are either new or lapsed (22% and 26%, respectively). However, when digging into the individual segments, the opportunity becomes more clear among segments that are categorized as non-loyal.
Segment Movement
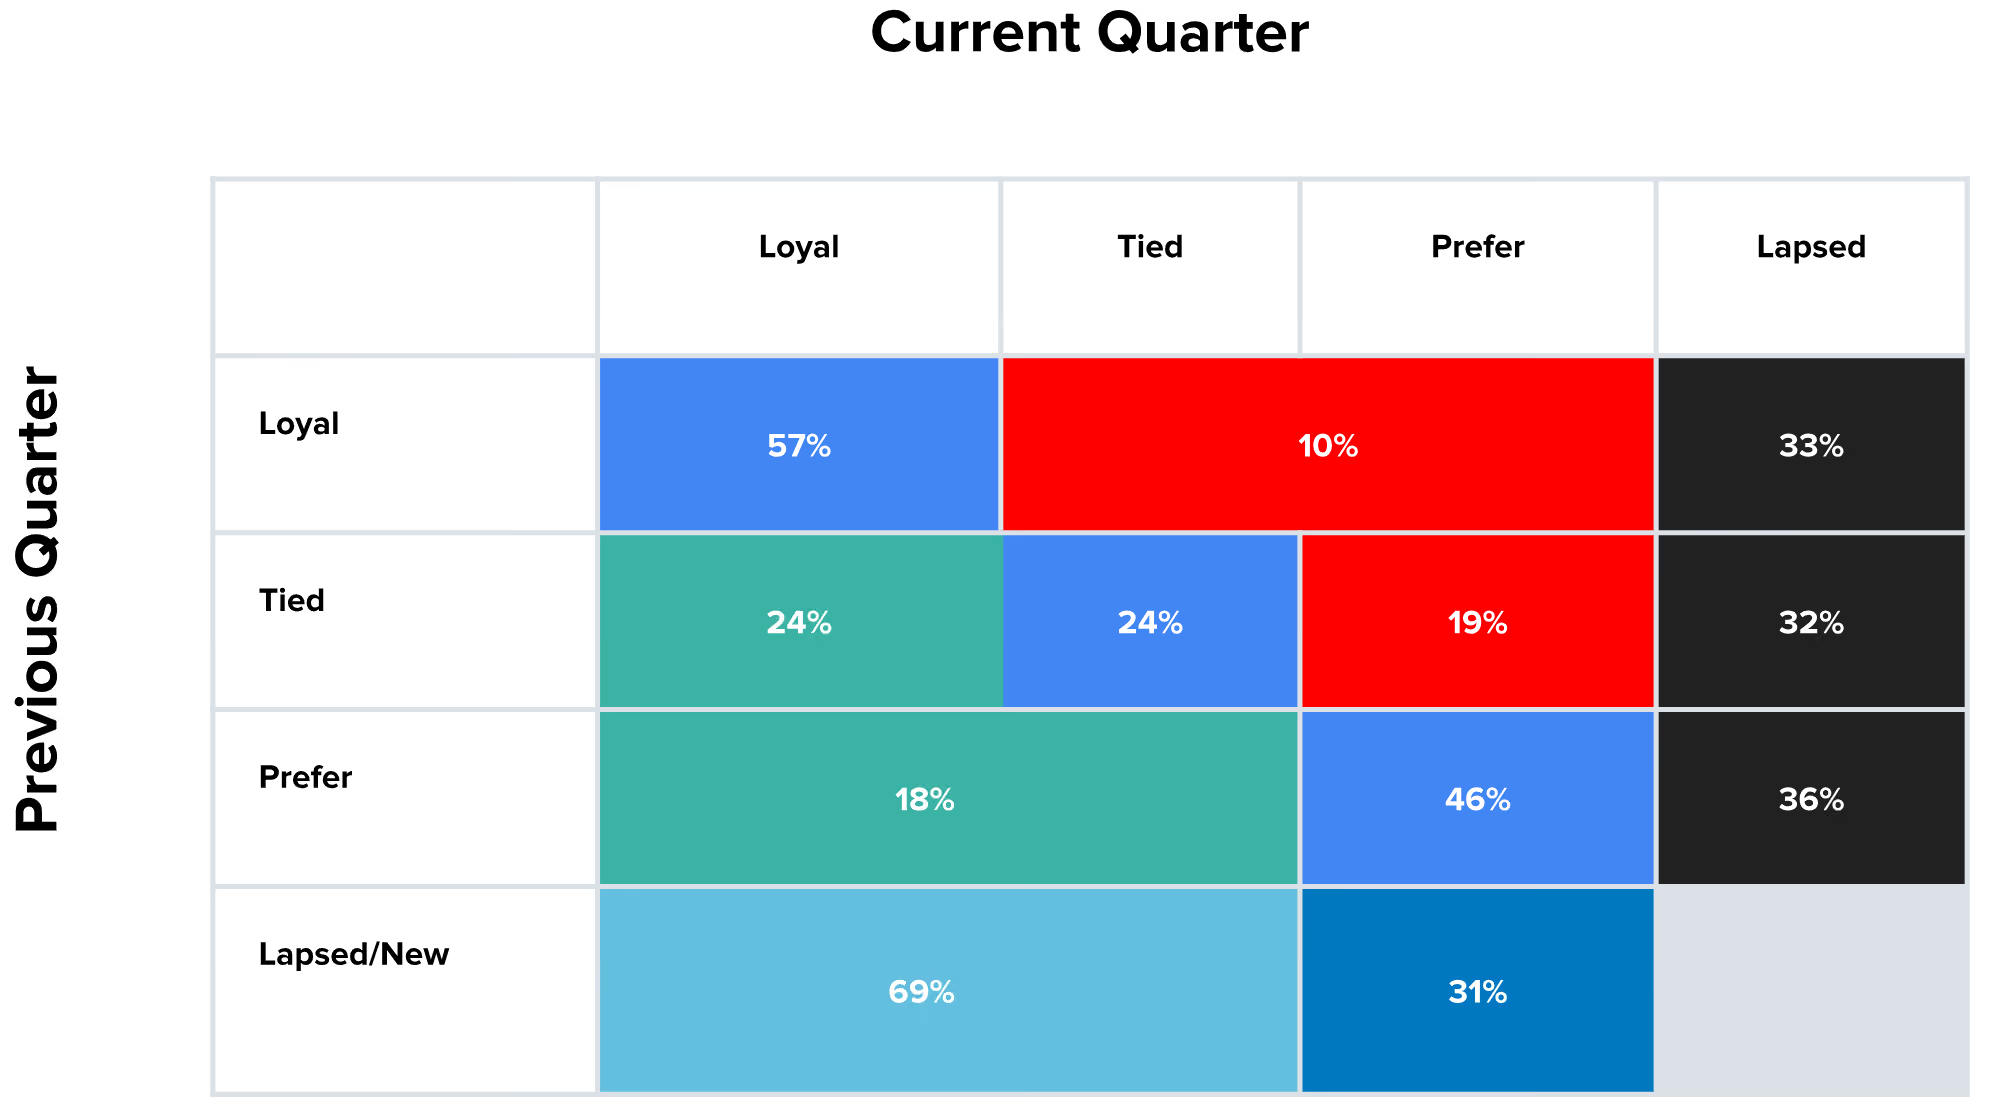
Of the ⅔ of each customer segment that is non-lapsed, those that are loyal to a specific airline tend to stay loyal (57%). However, those categorized as “non-loyal” (Tied/Prefer) show significant willingness to to shop around (43% and 46%, respectively).
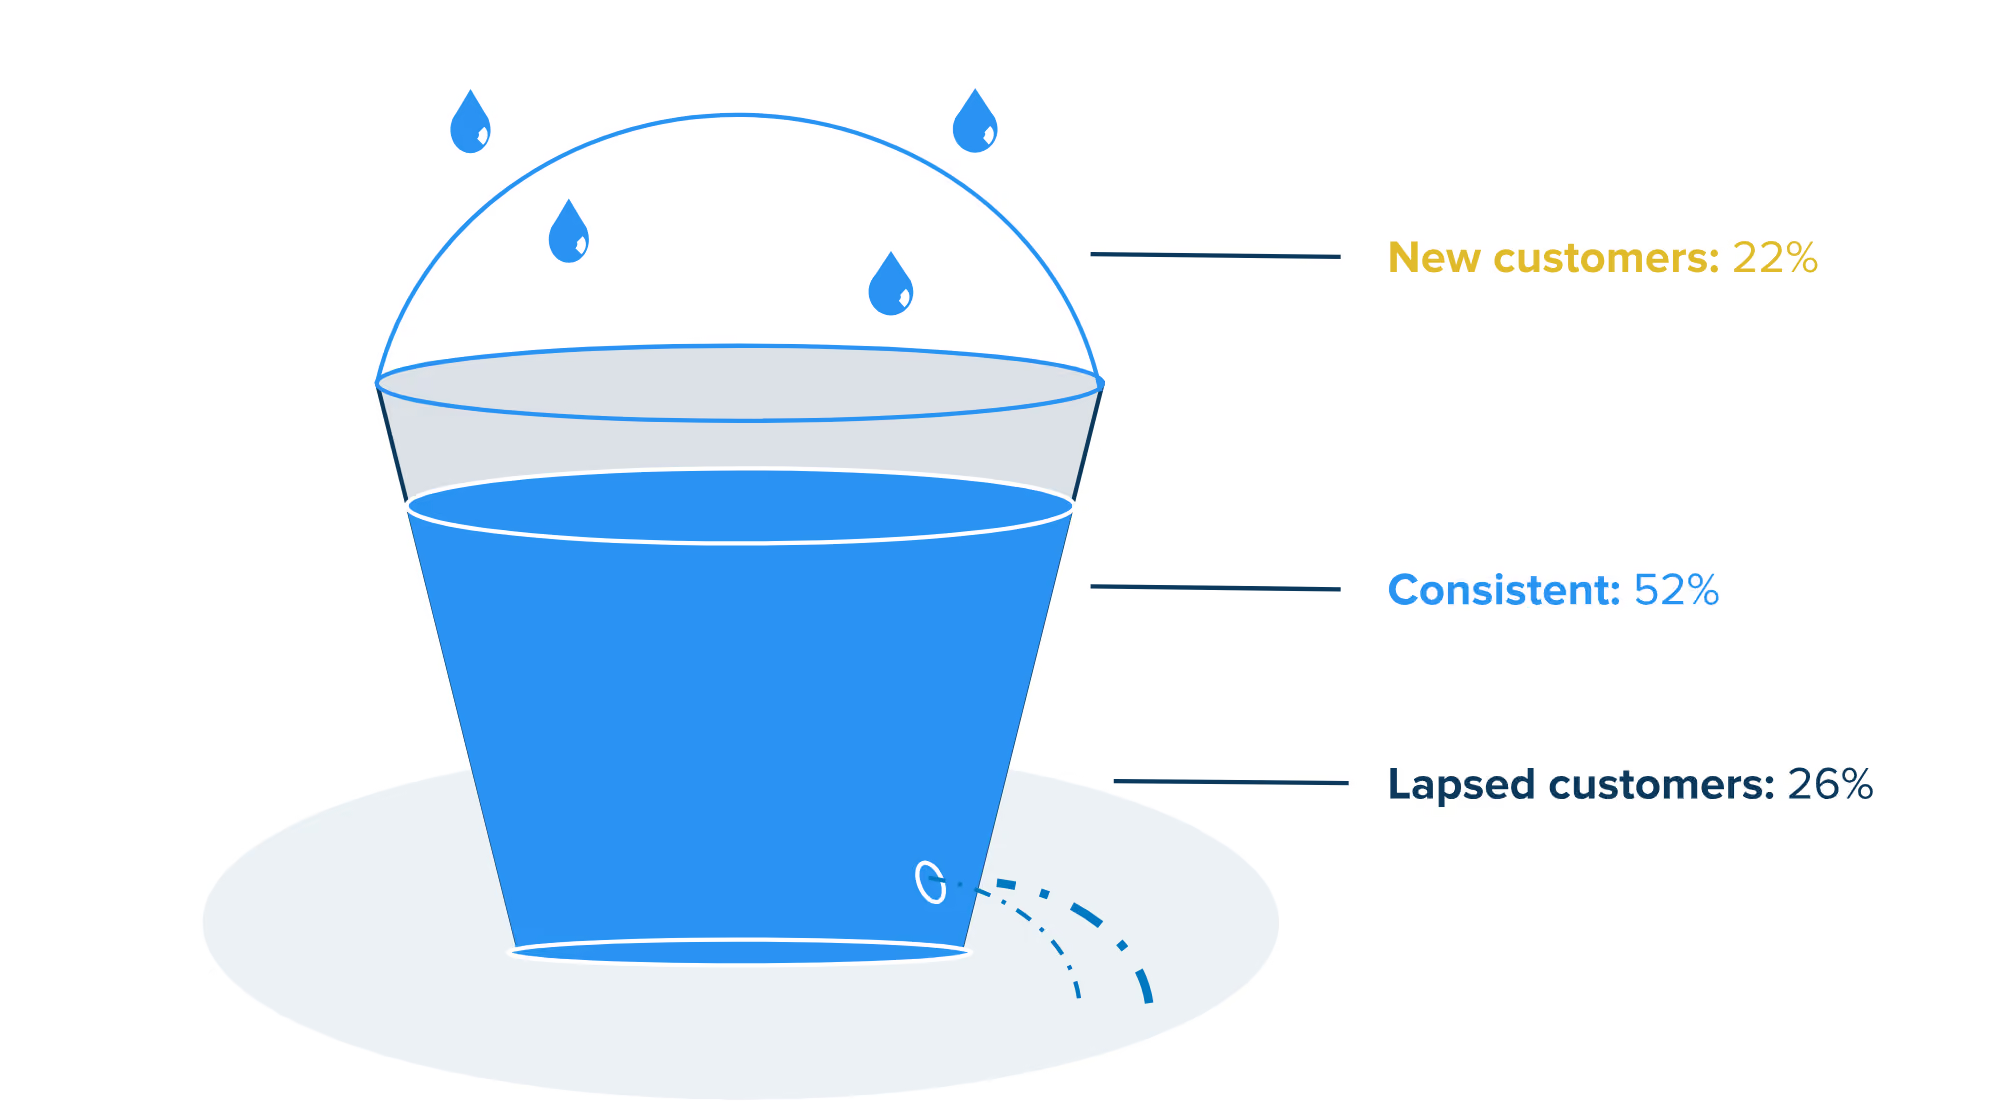
Airline Leaky Bucket
Airlines are acquiring new customers yet even more existing customers are moving into the lapsed tier. This cycle is expected based on typical consumer behavior for airline travel quarter over quarter but reinforces need to nurture existing relationships .
Diving deeper into the individual segments tells us:
- Loyal customers typically do not switch airlines, which is most likely due to airlines robust loyalty programs and incentives. However, customers that are Tied or Prefer have a high propensity for behavior change and show an opportunity for targeted campaigns to influence their behavior.
- Lapsed customers are similar across all segments, which is reflective of typical airline purchasing behavior - regardless of their loyalty categorization.
Definitions of Customer Segments
Loyal Customers
Loyal: Only shop with a specific brand, or have the highest share of wallet with a given brand and relative rank is lower than all other brands in consideration set
Not Loyal Customers
Tied: Similar relative ranks to 2 or more brands regardless of share of wallet ranking
Prefer: Lower share of wallet and higher rank than other brands in their consideration set
Lapsed: Shopped historically but do not shop currently, as defined by the analysis time period
New: Shop currently but have not shopped historically, as defined by the analysis time period
Takeaways
Airline marketers’ inherent focus on nurturing loyal customers is well-know and consumer spend data show it’s working - Loyal customers tend to stay loyal. But huge opportunity exists with customers who are not loyal to any specific airline and could be lured through greater incentives. To stay top of mind, marketers must continuously nurture relationships, understand customer needs, and offer seamless experiences. To foster loyalty with your customers, consider these recommendations:
- Use an “always on” strategy to keep customers engaged, regardless of purchase frequency.
- Regularly update/refine customer segments and adjust reward offers to keep them engaged.
- Use targeted campaigns to boost loyalty and revenue.
Cardlytics can deliver a comprehensive Customer Loyalty Analysis with insights into customer behavior and movement across defined loyalty segments. Contact us for more details.
* For this report, we've selected the entire Airlines category in our data, collectively representing$58bn in annual card spend. This sample differs from the previous Customer Loyalty Analysis report.
About Cardlytics
Cardlytics (NASDAQ: CDLX) is a commerce media platform, powered by our publishers’ first-party purchase data, that makes commerce smarter and more rewarding for everyone. We offer a range of solutions to help advertisers and publishers, including financial institutions, grow and strengthen customer loyalty. With visibility into approximately half of all card-based transactions in the U.S. and a quarter in the U.K., Cardlytics enables advertisers to engage consumers at scale and drive incremental sales through our industry-leading financial media network. Publisher partners can enhance their platforms with relevant and personalized offers that improve the shopping experience for their customers. Cardlytics also offers identity resolution capabilities through Bridg, which helps convert anonymous shoppers into known and reachable customers. Headquartered in Atlanta, Cardlytics has offices in Menlo Park, Los Angeles, Champaign, New York and London. Learn more at www.cardlytics.com or follow us on LinkedIn.
UK Loyalty Movement Report: QSR
In this Report, we dive into customer behavior in the QSR category to better understand engagement over time by analyzing more than £5.8bn in consumer spend behavior
Introduction
In our previous report, Redefining Customer Loyalty, Cardlytics defined loyalty as a consumer’s preference for a merchant over its competitors. We analyzed billions in spending across six industries to measure customer loyalty and spending patterns with both loyal and non-loyal customers.
But customer behavior isn’t fixed—customers shift between loyalty segments over time. Understanding these shifts helps identify churn and informs strategies to nurture relationships and move customers to higher loyalty segments. In this Report, we dive into customer behavior in the QSR category to better understand engagement over time by analyzing more than £5.8bn in consumer spend behavior.*
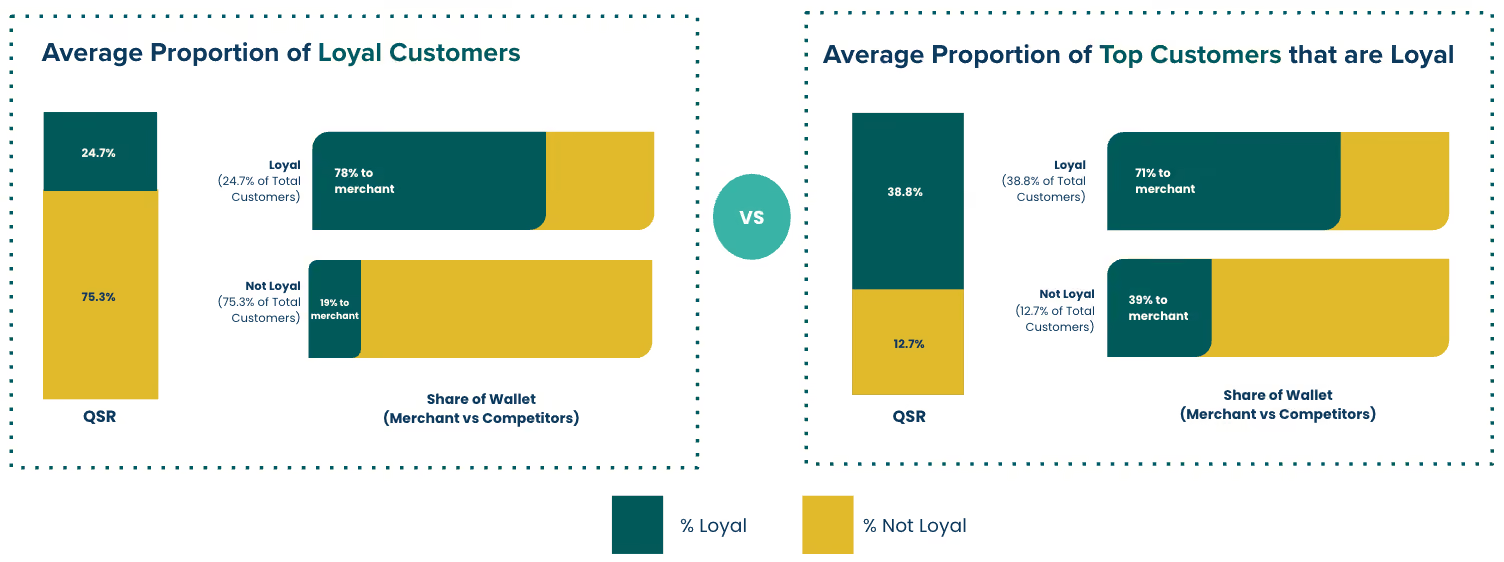
Findings: loyalty is fluid, not fixed
We looked into purchase data at all QSRs in the UK over the last 8 quarters (Q1-23 through Q4-24) on a quarter by quarter basis to see whether even the “most loyal” customers showed changes in their purchase behavior.
QSR Loyalty Movement
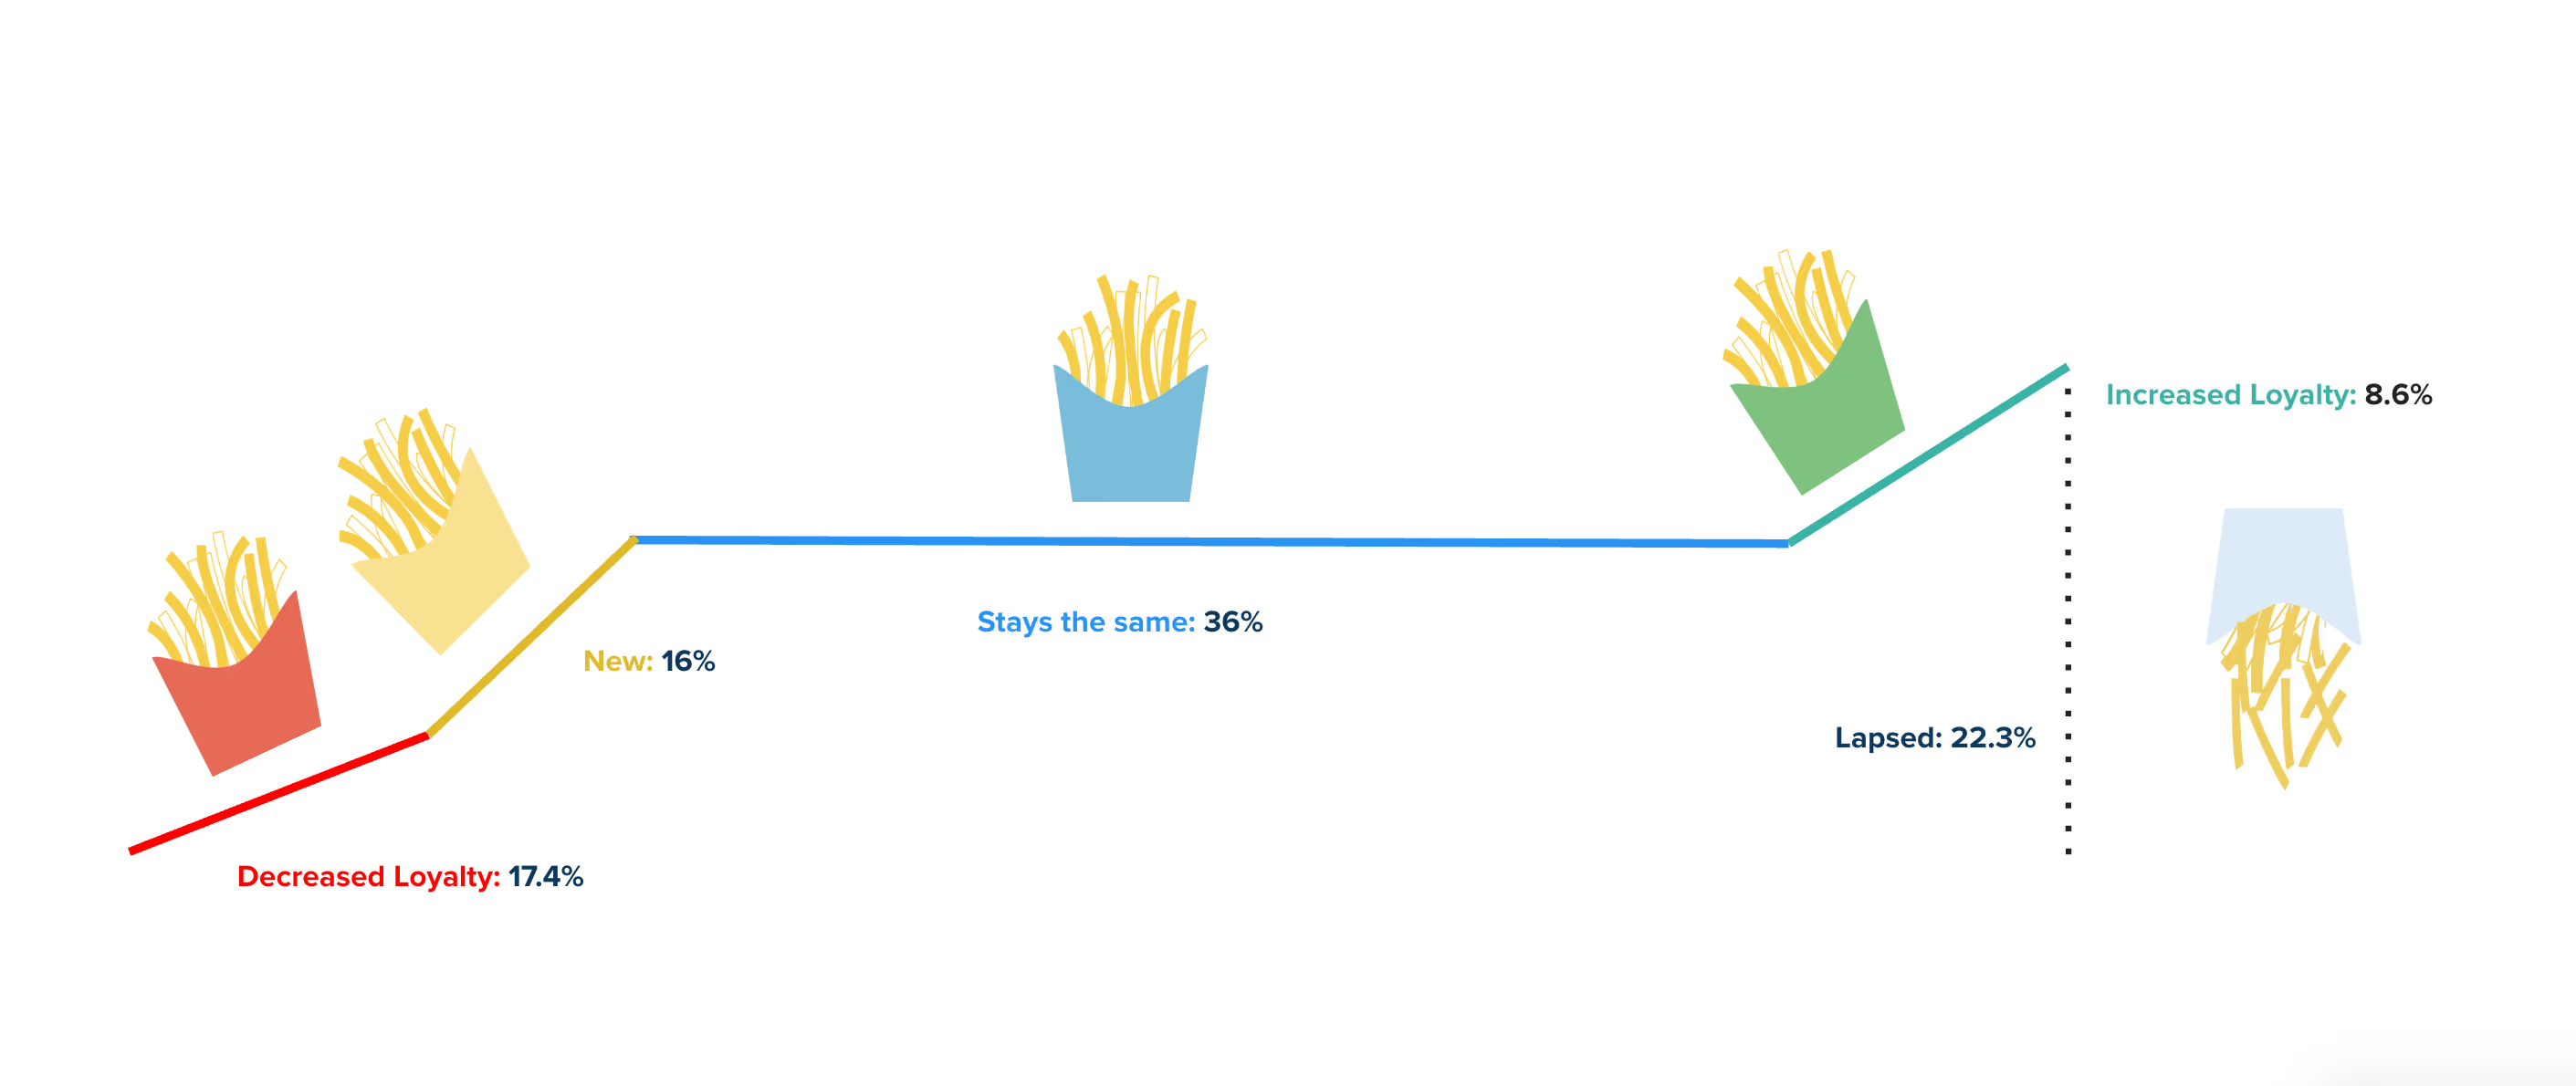
Overall, quarter over quarter, 36% of customers tend to remain in their existing segments and 26% increase or decrease their loyalty to a merchant, showing that QSR customers tend to be more promiscuous than other industries. Also, there is much more extensive customer loyalty movement within the “not loyal” segments.
Findings: segment movement
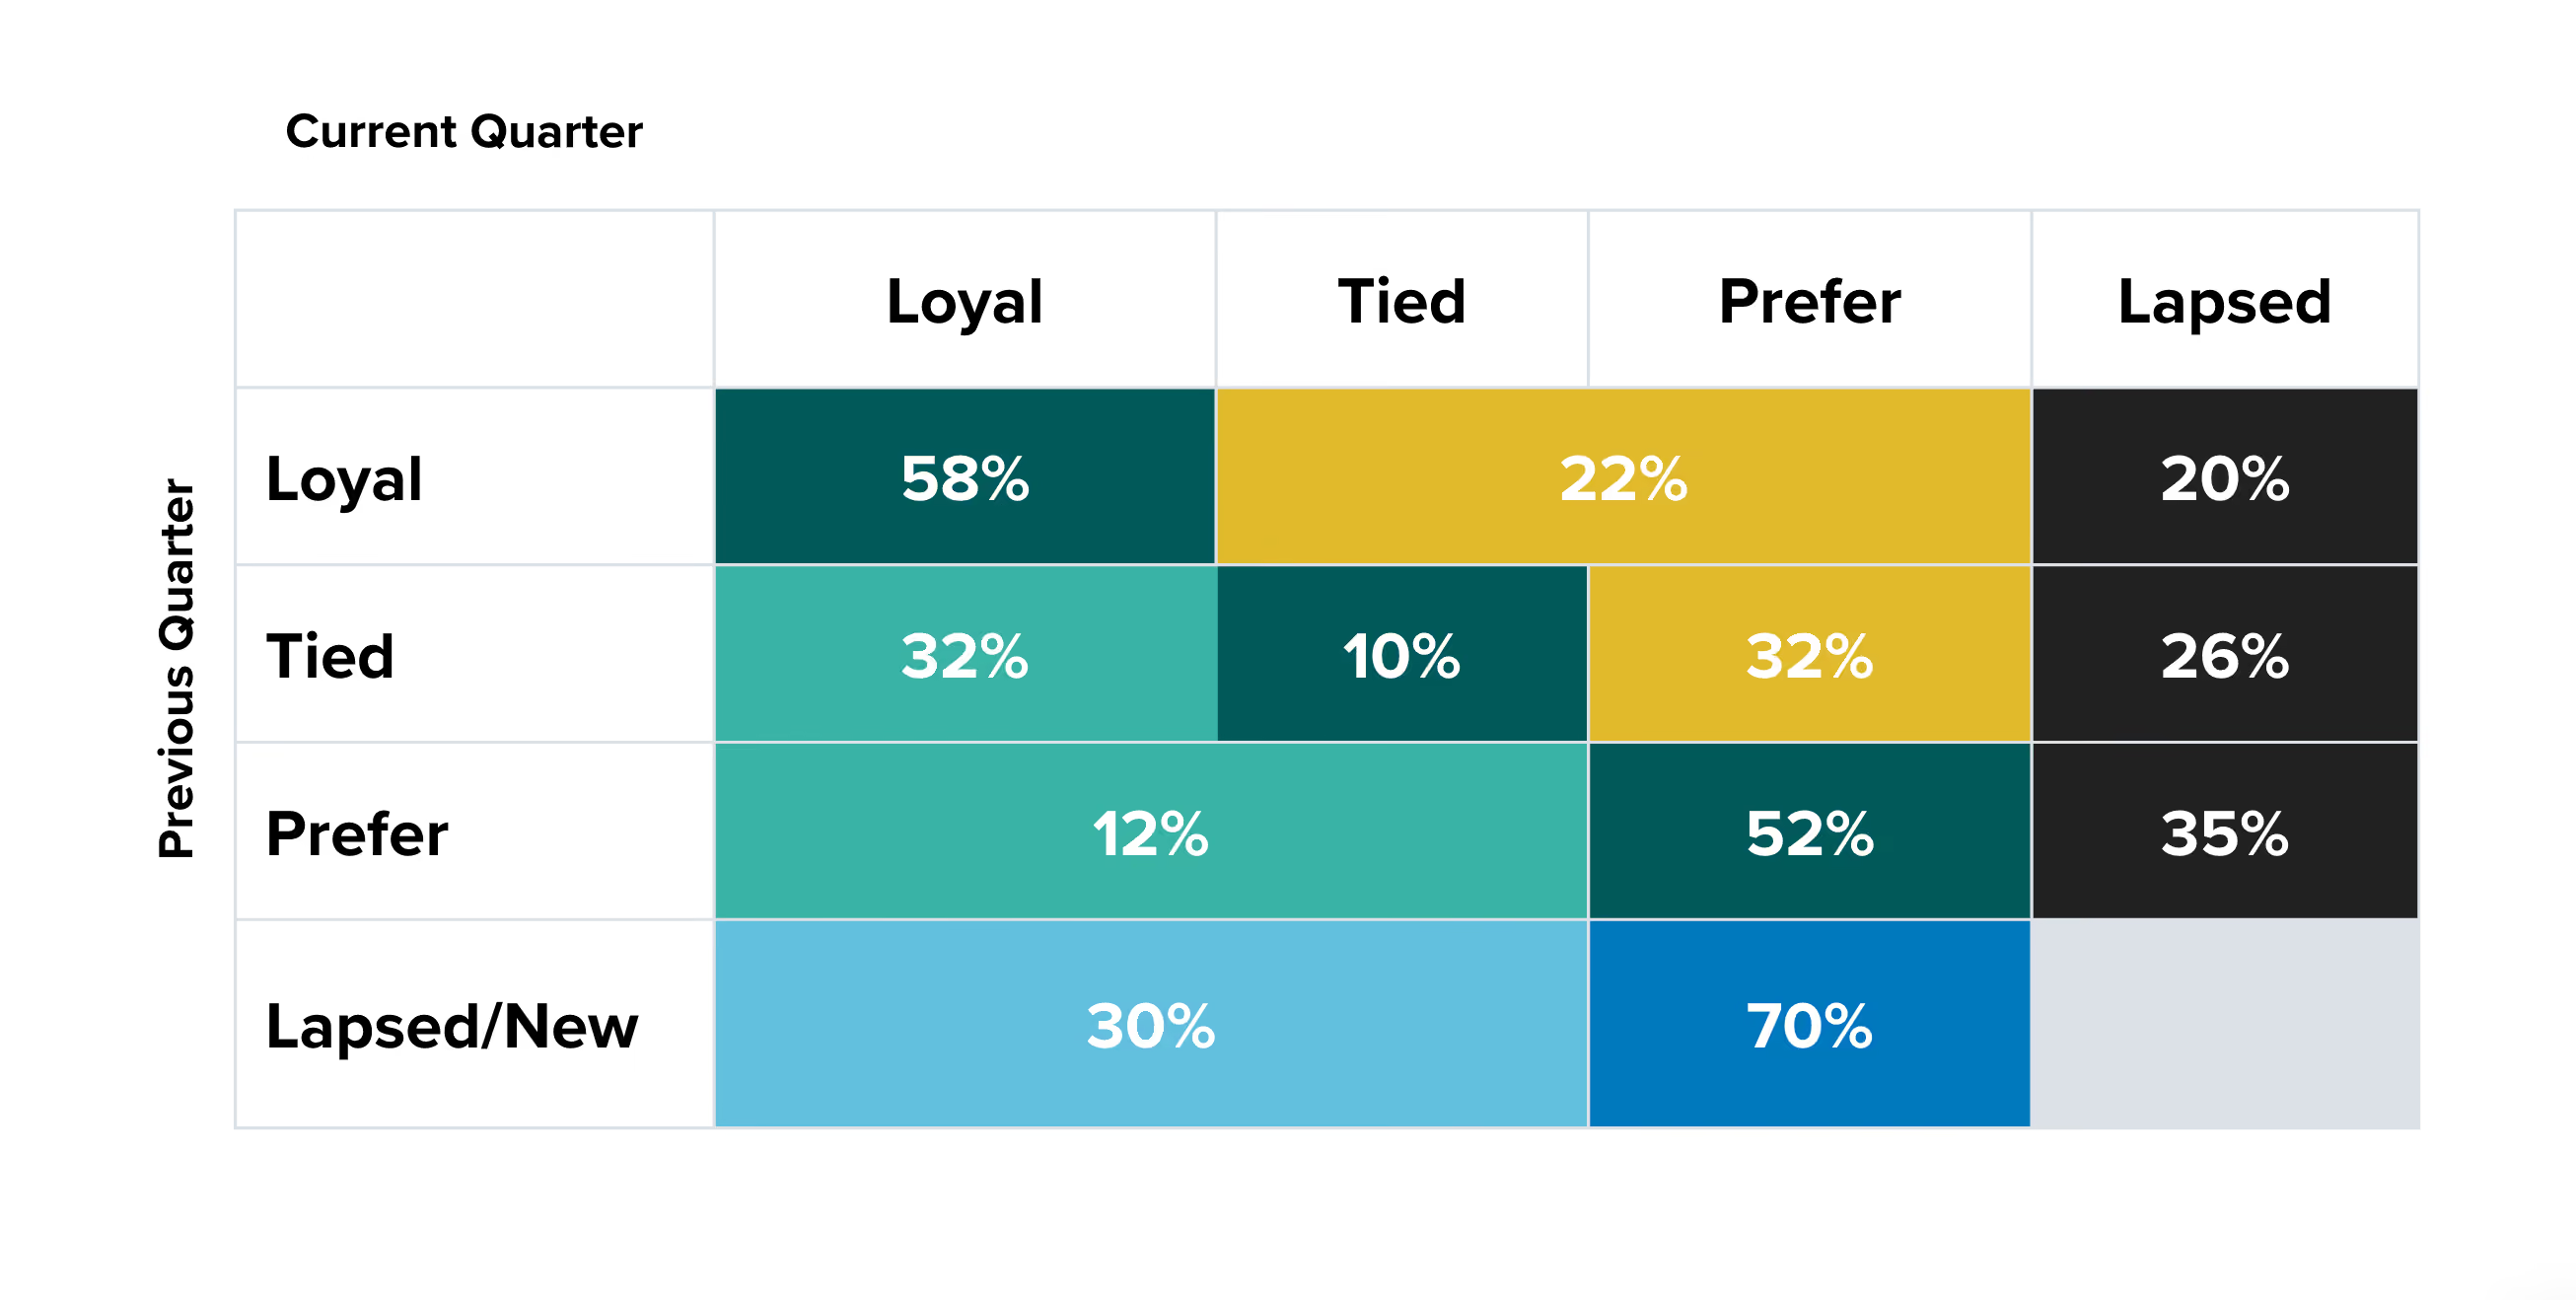
Diving deeper into the individual segments tells us:
- Loyal customers are the most stable, with 58% staying Loyal.
- Prefer customers also show strong retention — 52% remain in that segment.
- Tied customers are the most fluid — only 10% stay Tied, while 58% shift into Loyal or Prefer.
- Churn risk is highest for Prefer customers, with 35% lapsing — nearly 2x higher than Loyal customers (20%).
Segment movement
Customer movement is happening across all segments, but the Tied group shows the highest churn – only 10% remain Tied, while a combined 58% shift into either Loyal (32%) or Prefer (26%). This volatility signals an opportunity to convert mid-loyalty shoppers with targeted interventions.
QSR Leaky Bucket
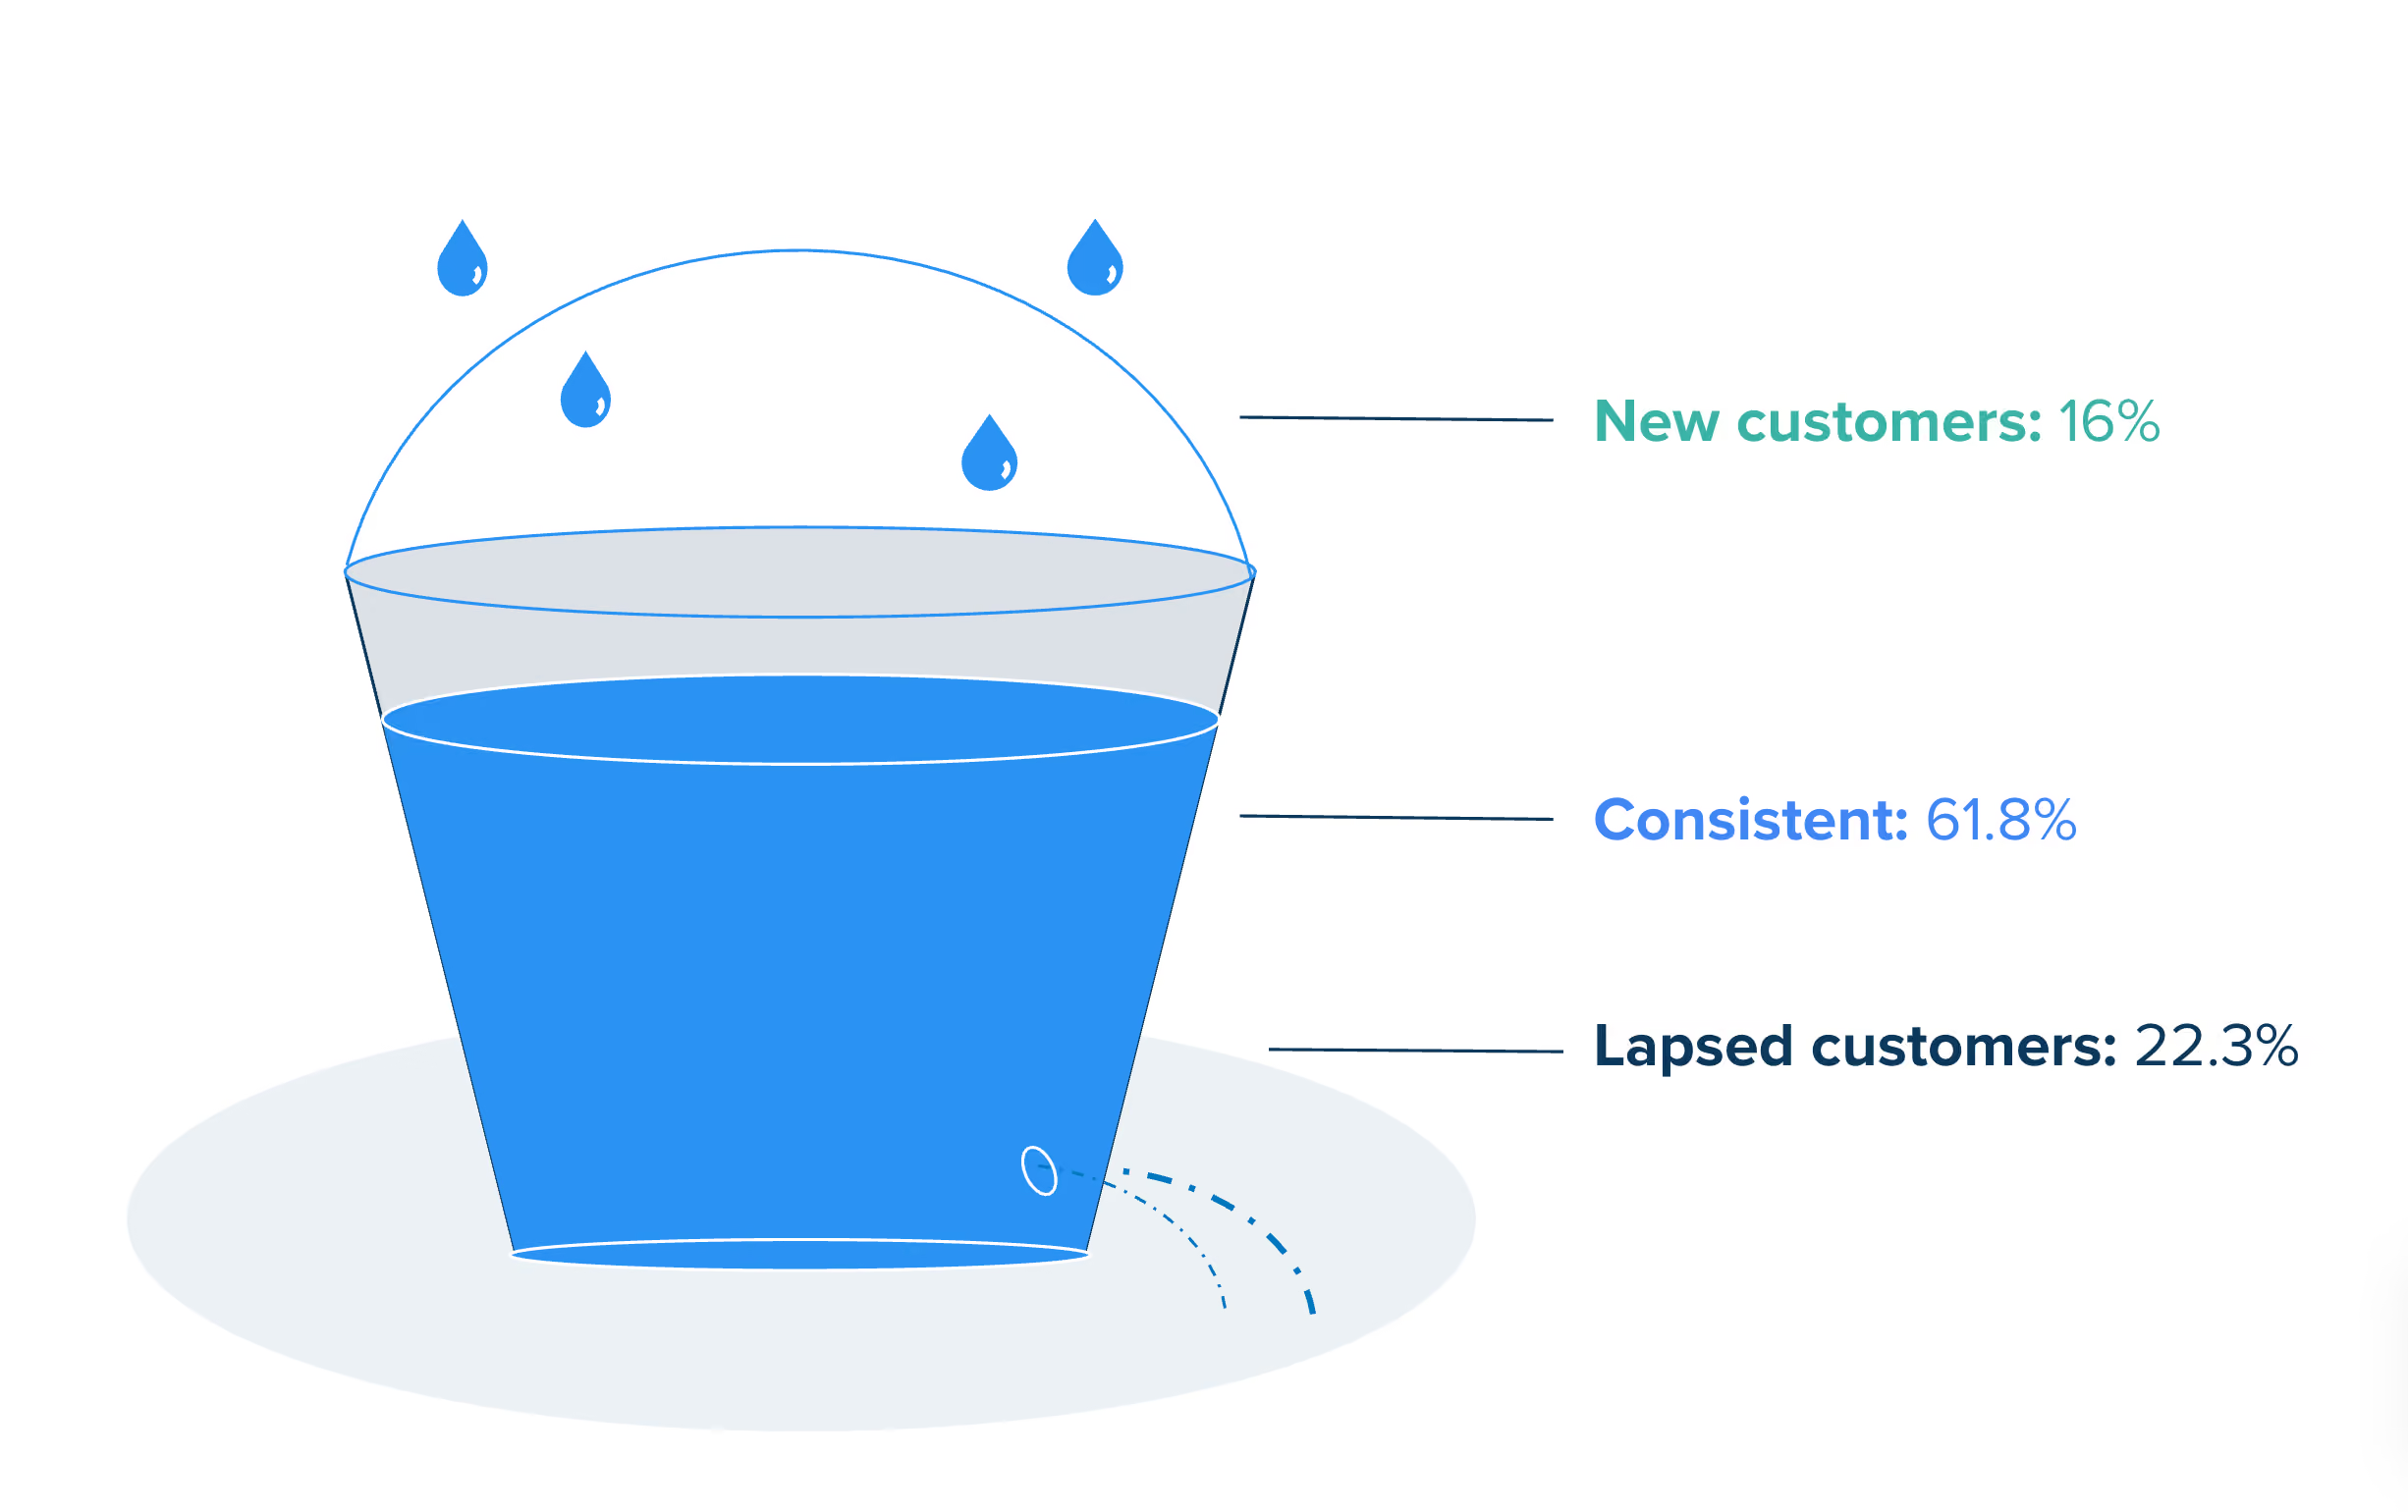
QSR brands are losing customers faster than they are acquiring them – with Lapsed customers (22.3%) outpacing New customers (15.9%). This signals a need to strengthen retention strategies to prevent long-term erosion of customer loyalty.
Takeaways: It’s more costly to acquire or re-acquire customers than to keep existing ones engaged.
Our analysis shows that 22% of QSR customers have lapsed, outpacing the 15.9% of new customers being acquired. Brands are at risk of net customer loss unless they prioritise loyalty-building efforts.
Our segment movement data also reveals that “Tied” customers are the most fluid, with 90% shifting into other behaviours — with both gains and losses. In contrast, Loyal customers remain relatively stable, and Prefer customers show moderate retention.
To protect and grow market share, marketers must go beyond acquisition. Nurturing relationships and strengthening loyalty can have a direct impact on retention and revenue.
To foster loyalty, consider these recommendations:
- Deploy an “always-on” strategy to stay connected with customers, regardless of purchase frequency.
- Continuously refine customer segments and tailor reward structures to reflect shifting behaviours.
- Launch targeted campaigns focused on converting fluid segments (like Tied and Prefer) into Loyal customers.

Loyalty Movement Report: QSR
In our Loyalty Movement Report, we dive into customer behavior in the QSR category to better understand engagement over time by analyzing more than $400B in consumer spend behavior.
The Secret Sauce to Retaining Customers
Introduction
In our previous report, Redefining Customer Loyalty, Cardlytics defined loyalty as a consumer’s preference for a merchant over its competitors. We analyzed $160B in spending across six industries to measure customer loyalty and spending patterns with both loyal and non-loyal customers.
But customer behavior isn’t fixed—customers shift between loyalty segments over time. Understanding these shifts helps identify churn and informs strategies to nurture relationships and move customers to higher loyalty segments. In our Loyalty Movement Report, we dive into customer behavior in the QSR category to better understand engagement over time by analyzing more than $44B in consumer spend behavior.*
QSR Category Loyal Customers
On average, 81% of the category’s customers are not actually loyal to any brand. But the loyal segment has a much higher share of wallet (67%) than a not loyal segment (15%).
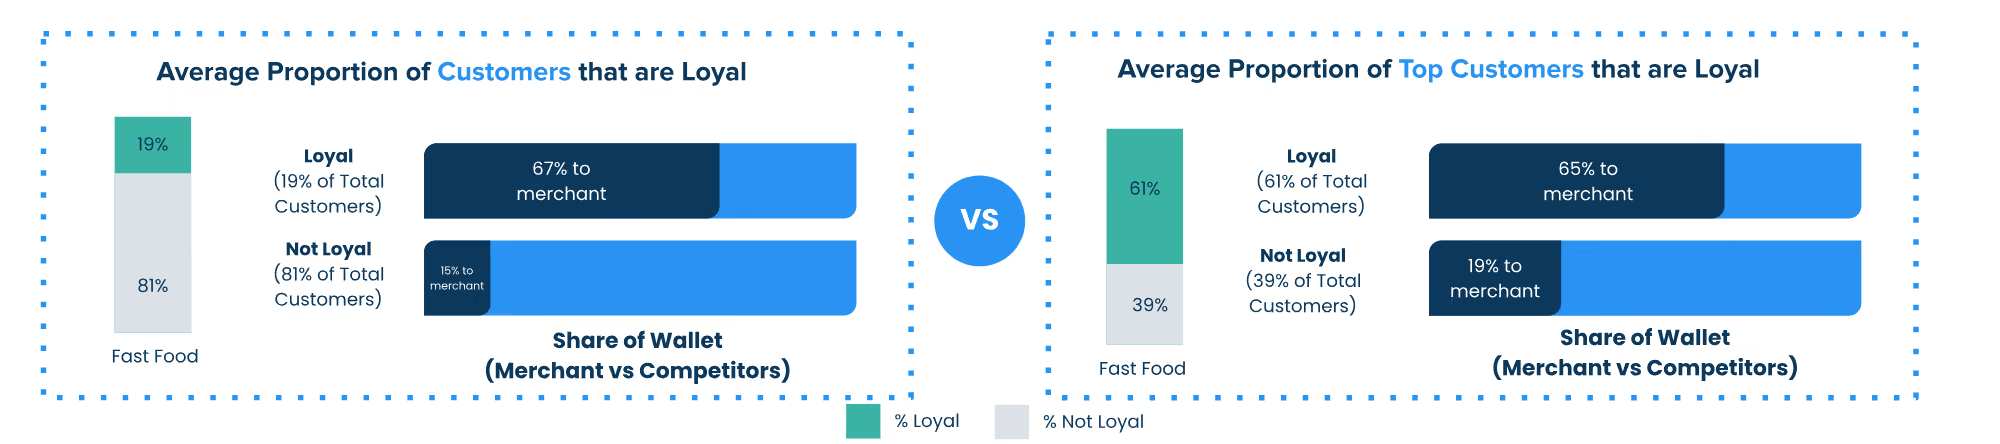
Top Customers (top 10% of most frequent transactors) are show reverse allegiance vs overall customers. And the loyal customer segment shows more than 3x higher share of wallet.
Findings
We looked into purchase data at all QSRs in the US over the last 8 quarters (Q1-23 through Q4-24) on a quarter by quarter basis to see whether even the “most loyal” customers showed changes in their purchase behavior.
QSR Loyalty Movement
Overall, quarter over quarter, 58% of customers tend to remain in their existing segments and 21% increase or decrease their loyalty to a merchant, showing that QSR customers tend to be more promiscuous than other industries. Also, there is much more extensive customer loyalty movement within the “not loyal” segments.
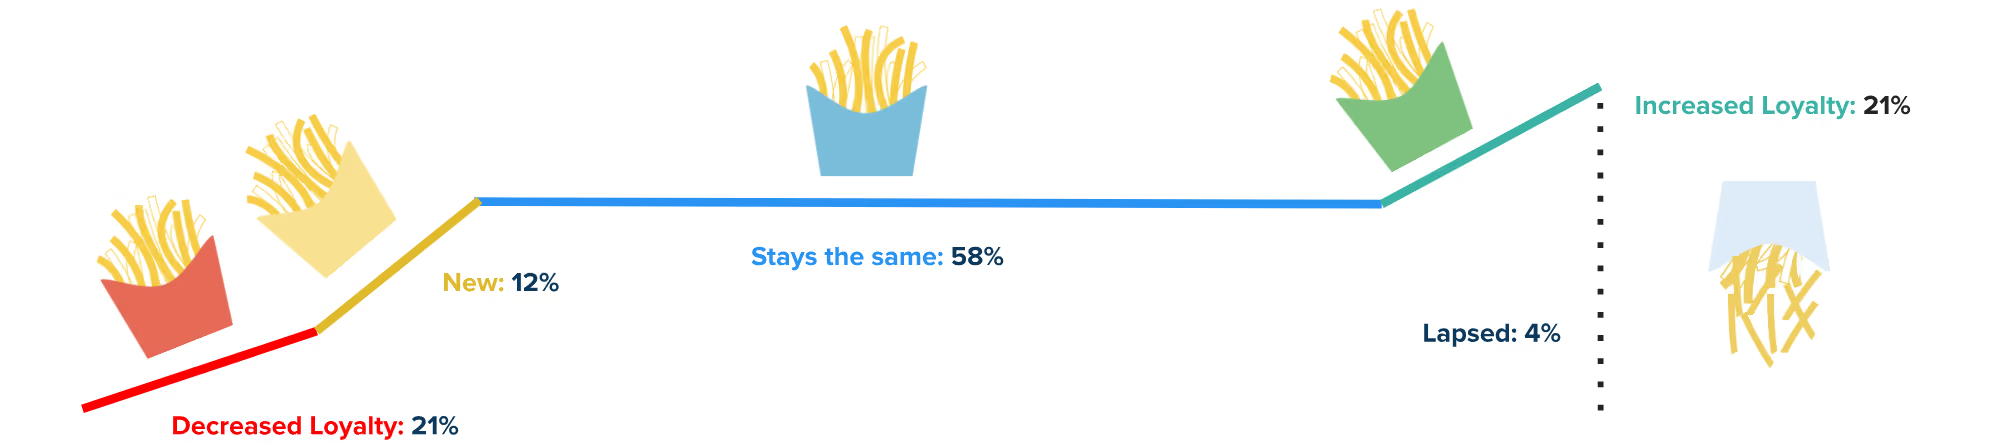
Segment Movement
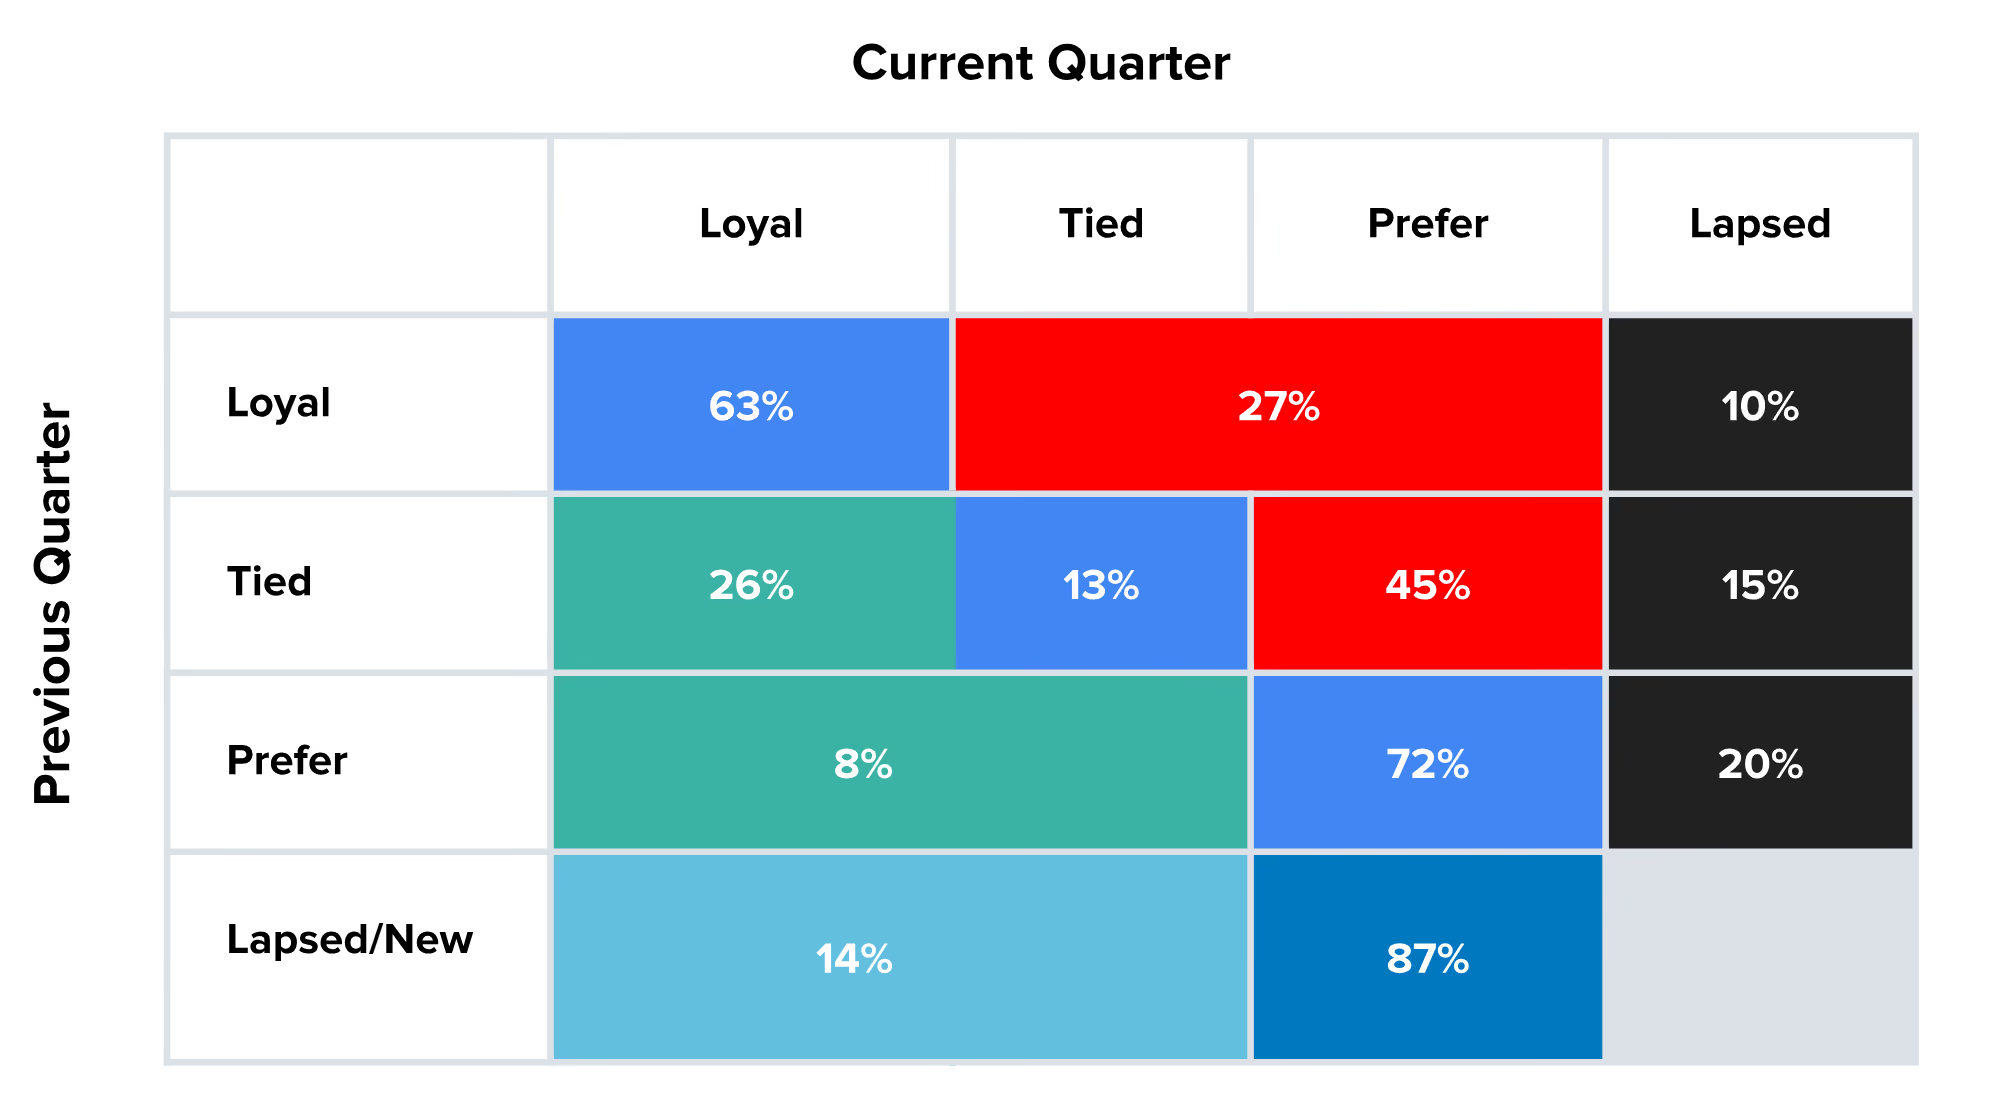
While all segments show purchase behavior movement, the Tied segment (part of Not Loyal customers) shows the most movement - both up (26%) and down (45%) - into other segments.
QSR Leaky Bucket
QSR brands are acquiring new customers at a 3x faster clip than they are losing customers. Yet these customers are less loyal to any specific brand so nurturing the relationship is key.
Diving deeper into the individual segments tells us:
- Loyal customers and those that Prefer the competition are the most rigid (with 63% and 72% staying the same, respectively). Those customers that are Tied have the greatest propensity for a behavior change (with only 13% staying the same).
- Loyal customers are far less likely to churn. Customers that are Tied are 50% more likely to churn and customers that Prefer the competition are 100% more likely to churn!
Definitions of Customer Segments
Loyal Customers
Loyal: Only shop with a specific brand, or have the highest share of wallet with a given brand and relative rank is lower than all other brands in consideration set
Not Loyal Customers
Tied: Similar relative ranks to 2 or more brands regardless of share of wallet ranking
Prefer: Lower share of wallet and higher rank than other brands in their consideration set
Lapsed: Shopped historically but do not shop currently, as defined by the analysis time period
New: Shop currently but have not shopped historically, as defined by the analysis time period
Takeaways
Marketers know it’s more costly to acquire or re-acquire customers than to keep existing ones engaged. When QSRs neglect current customers, they risk losing them and undoing past investment - not loyal customers are 50%-100% more likely to lapse/churn than loyal customers. But also QSRs are doing a relatively good job of bringing in new customers so staying top of mind is even more important. Marketers must continuously nurture relationships, understand customer needs, and offer seamless experiences. To foster loyalty with your customers, consider these recommendations:
- Use an “always on” strategy to keep customers engaged, regardless of purchase frequency.
- Regularly update/refine customer segments and adjust reward offers to keep them engaged.
- Use targeted campaigns to boost loyalty and revenue.
Cardlytics can deliver a comprehensive Customer Loyalty Analysis with insights into customer behavior and movement across defined loyalty segments. Contact us for more details.
* *For this report, we've selected the entire QSR category in our data, collectively representing over $44B in annual card spend. This sample differs from the previous Customer Loyalty Analysis report.
About Cardlytics
Cardlytics (NASDAQ: CDLX) is a commerce media platform, powered by our publishers’ first-party purchase data, that makes commerce smarter and more rewarding for everyone. We offer a range of solutions to help advertisers and publishers, including financial institutions, grow and strengthen customer loyalty. With visibility into approximately half of all card-based transactions in the U.S. and a quarter in the U.K., Cardlytics enables advertisers to engage consumers at scale and drive incremental sales through our industry-leading financial media network. Publisher partners can enhance their platforms with relevant and personalized offers that improve the shopping experience for their customers. Cardlytics also offers identity resolution capabilities through Bridg, which helps convert anonymous shoppers into known and reachable customers. Headquartered in Atlanta, Cardlytics has offices in Menlo Park, Los Angeles, Champaign, New York and London. Learn more at www.cardlytics.com or follow us on LinkedIn.

UK Loyalty Movement Report: Grocery
In this Loyalty Movement Report, we’ll dive deeper into customer in behavior in the UK across the Grocery category to better understand engagement over time.
Introduction
In our previous report, Redefining Customer Loyalty, Cardlytics defined loyalty as a consumer’s preference for a merchant over its competitors. We analysed billions in spending across six industries to measure customer loyalty and spending patterns with both loyal and non-loyal customers.
Customer behaviour isn’t fixed—shoppers move between loyalty segments over time. Our UK Grocery Loyalty Movement Report analyses national grocery spend to track these shifts, helping retailers identify churn, improve retention, and strengthen customer relationships.
Grocery Category Loyal Customers
On average, 75% of a merchant’s customers are not actually loyal. But the loyal segment (25%) has a much higher share of wallet (67%) than a not loyal segment (13%).
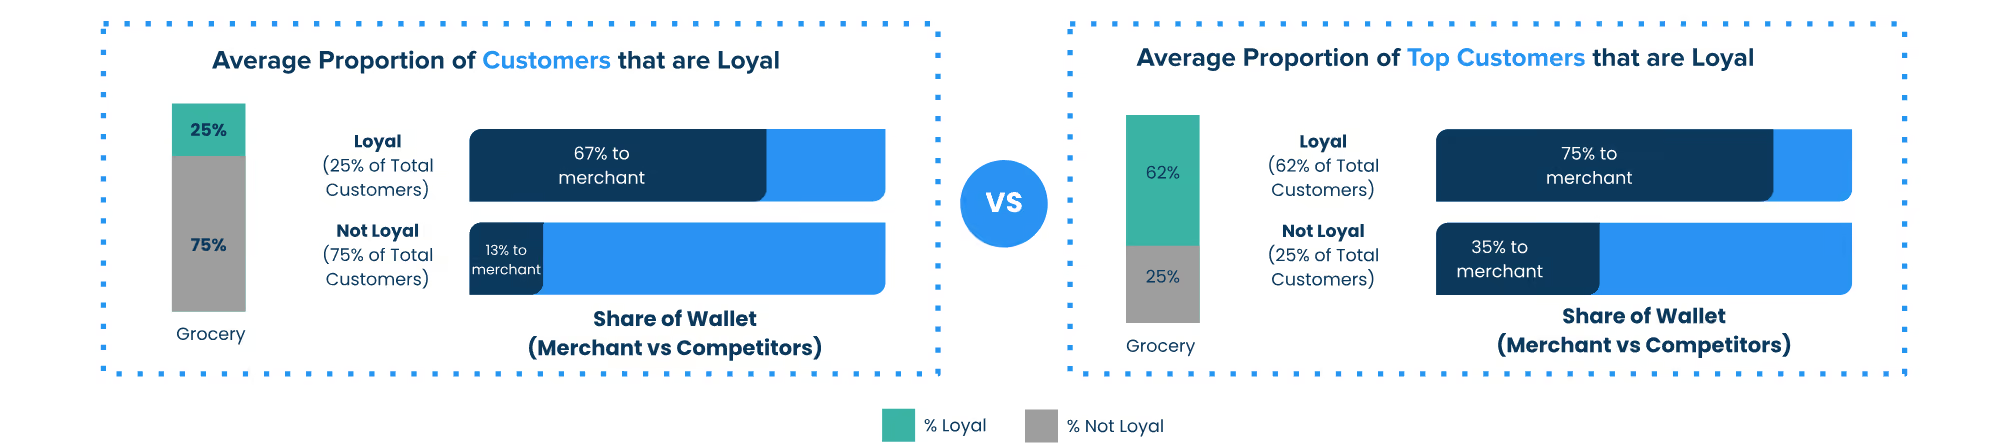
Top Customers (top 20% of most frequent transactors) still show that 25% are not loyal customers. Yet the loyal customer segment shows a 2x higher share of wallet.
Findings
We looked into purchase data at all groceries in the UK over the last 8 quarters (Q1-23 through Q4-24) on a quarter by quarter basis to see whether even the “most loyal” customers showed changes in their purchase behaviour.
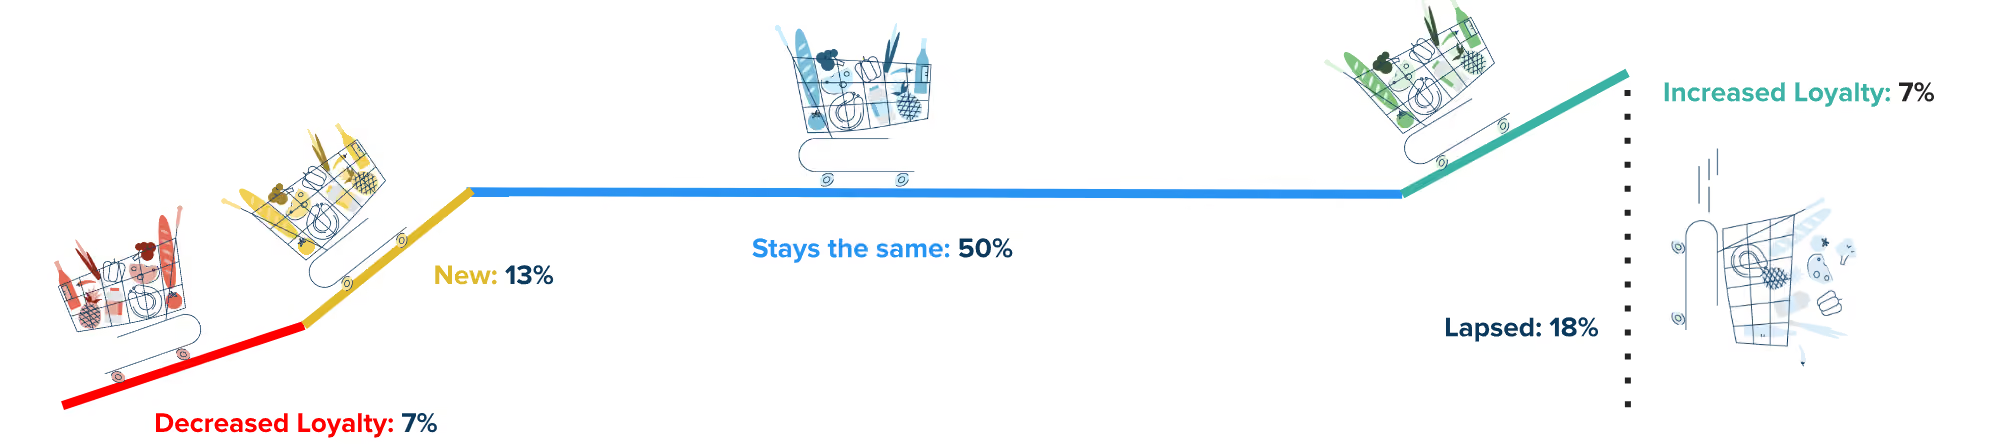
Grocery Loyalty Movement
Overall, quarter over quarter, 50% of customers tend to remain in their existing segments while 50% increase or decrease their loyalty to a merchant. Yet there is much more extensive customer loyalty movement within the “not loyal” segments.
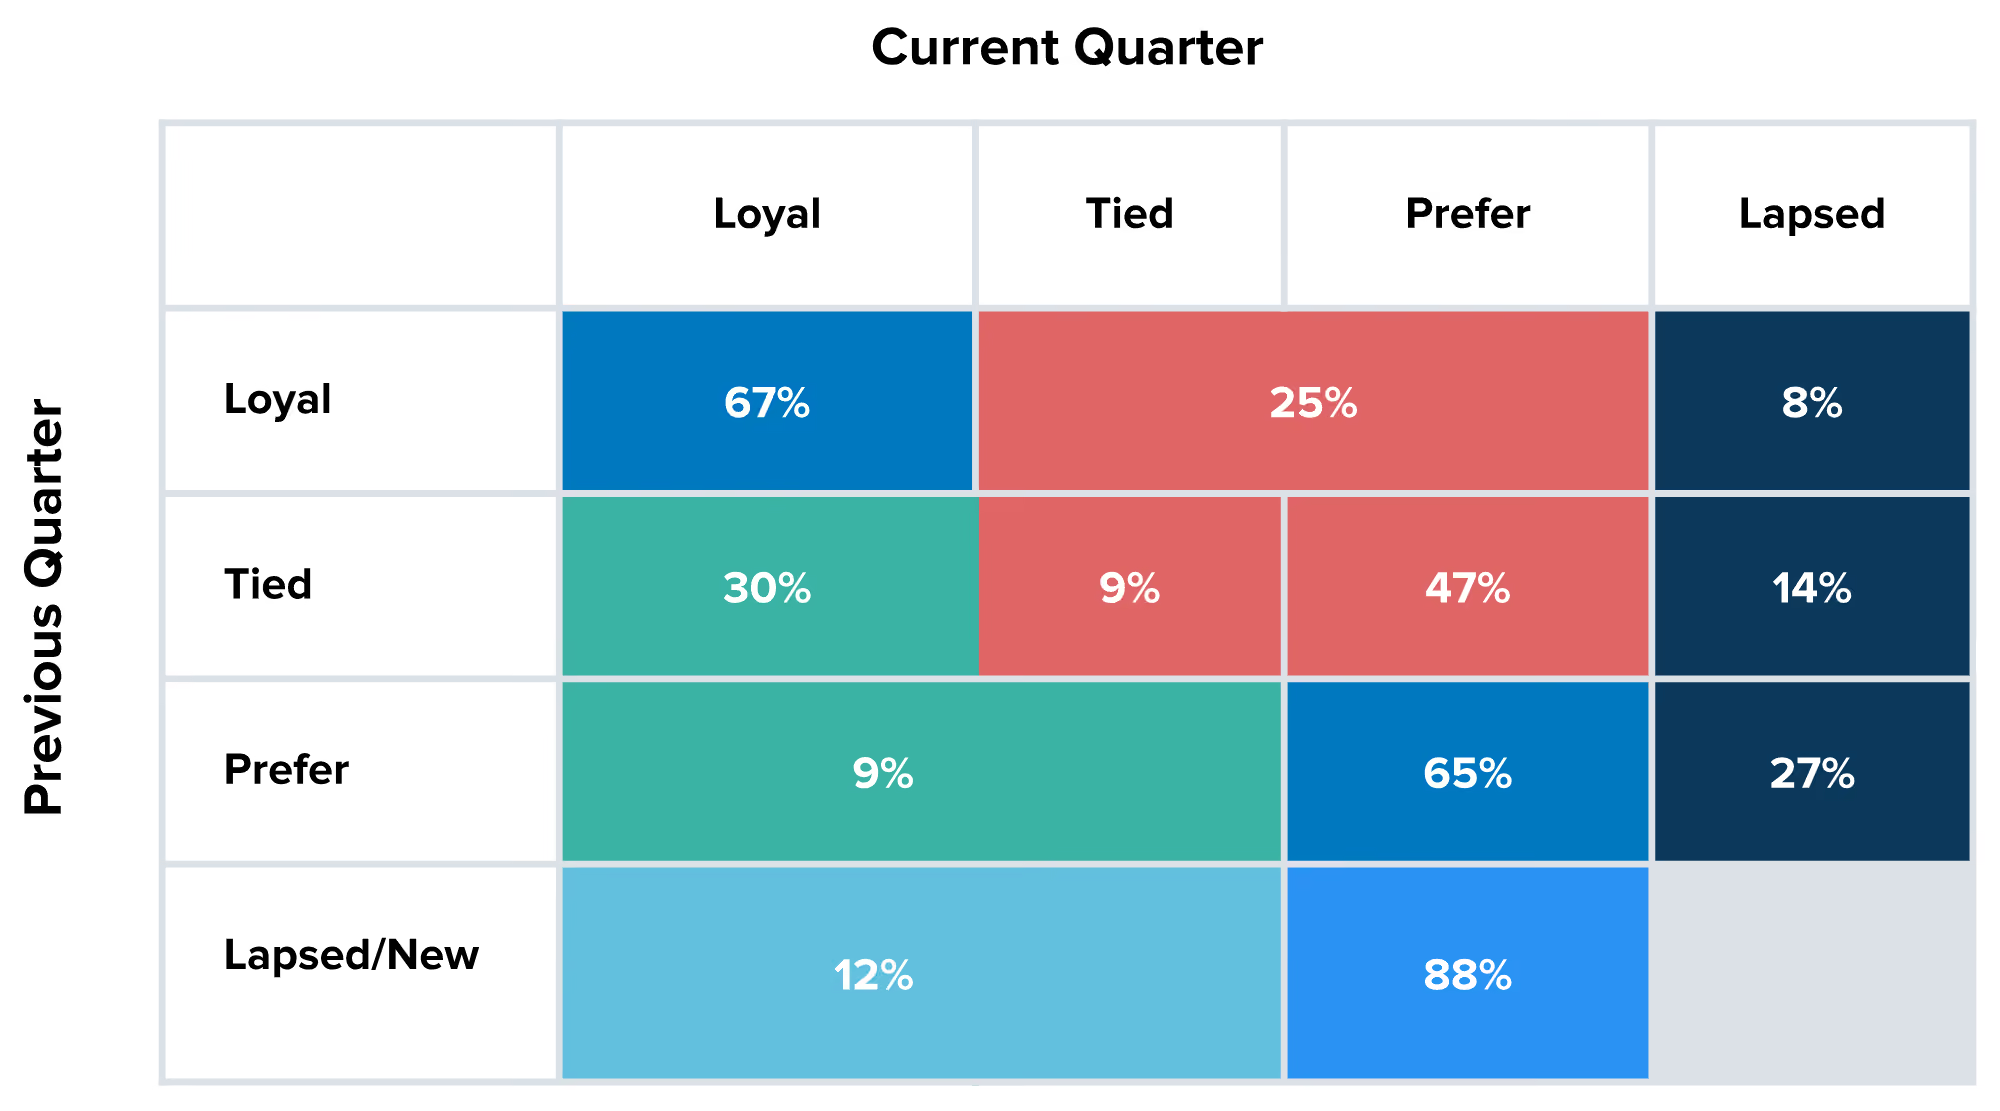
Segment Movement
While all segments show purchase behaviour movement, the Tied segment (part of Not Loyal customers) shows the most movement - both up (30%) and down (47%) - into other segments.
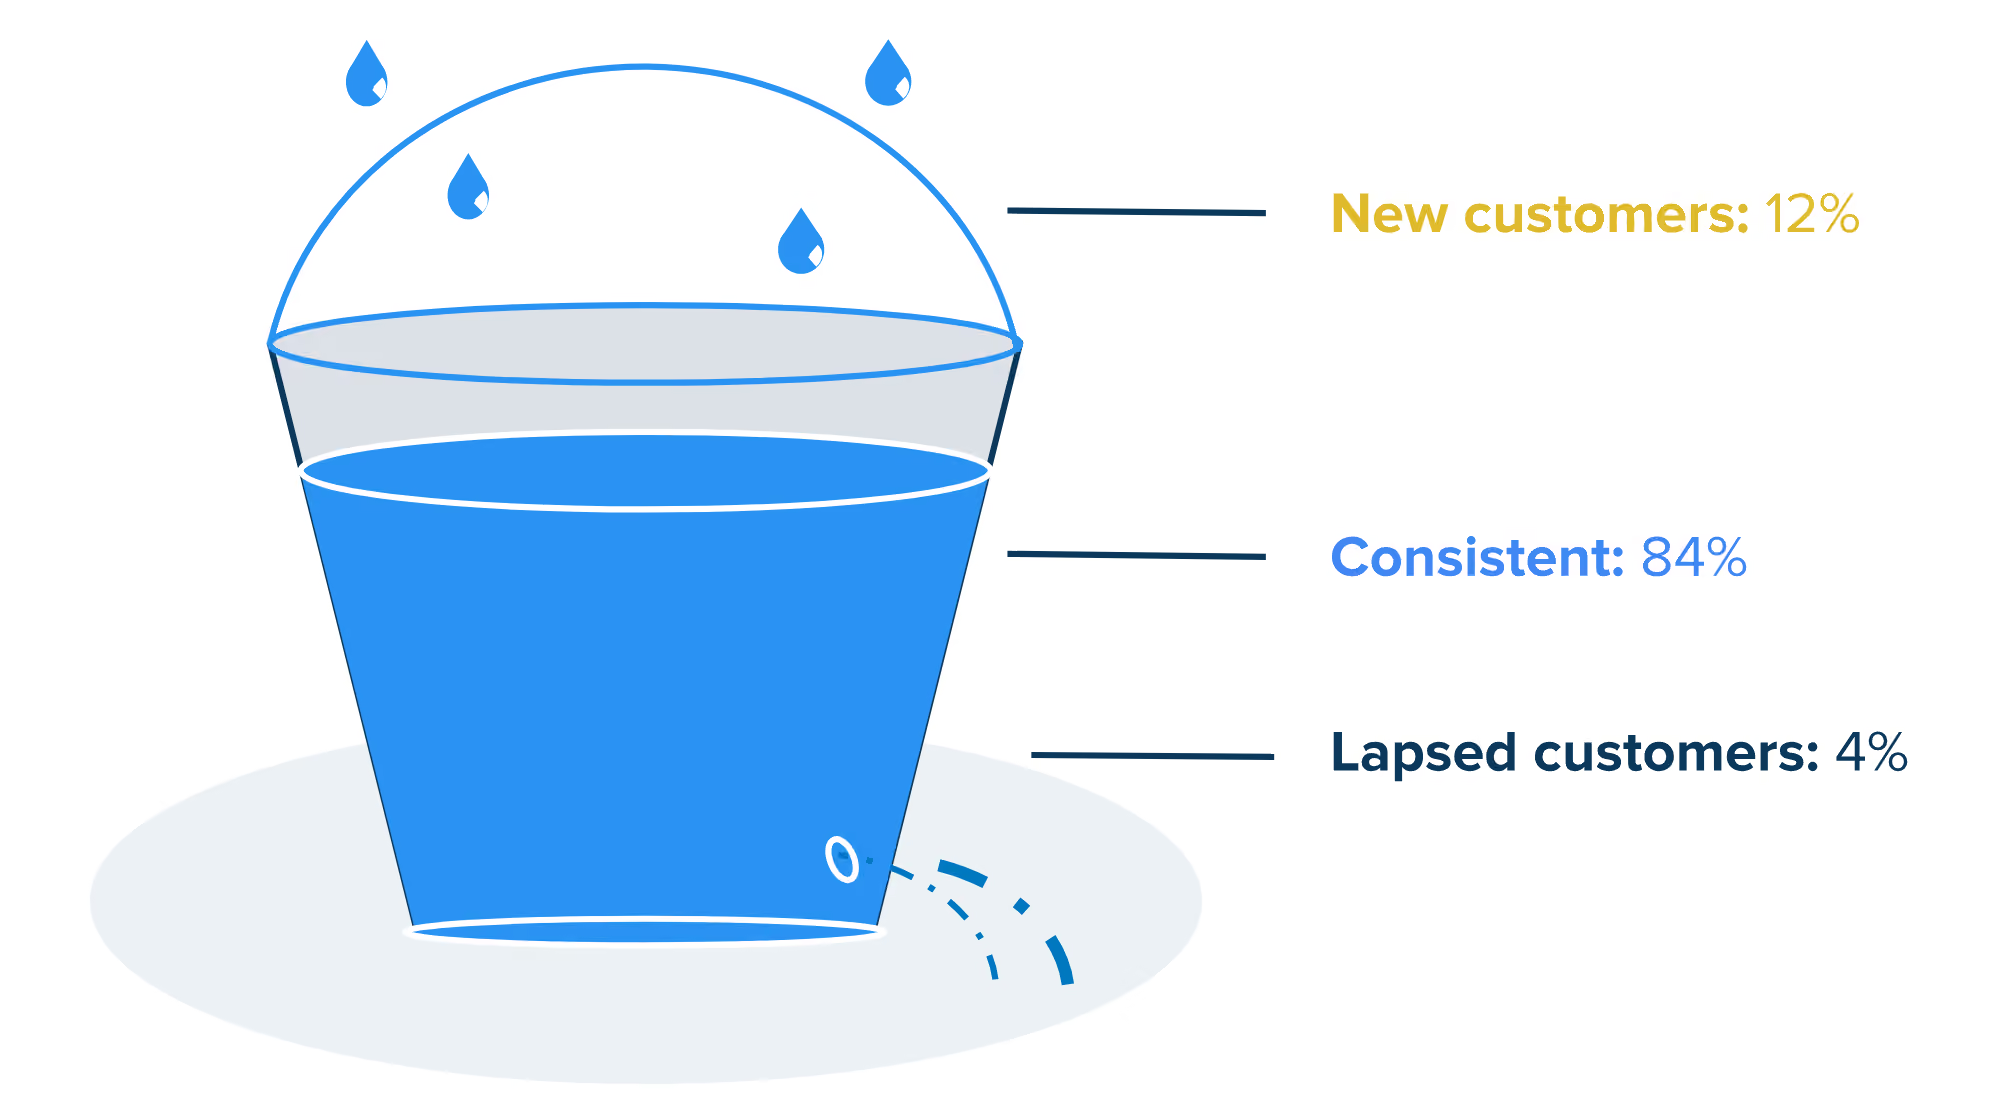
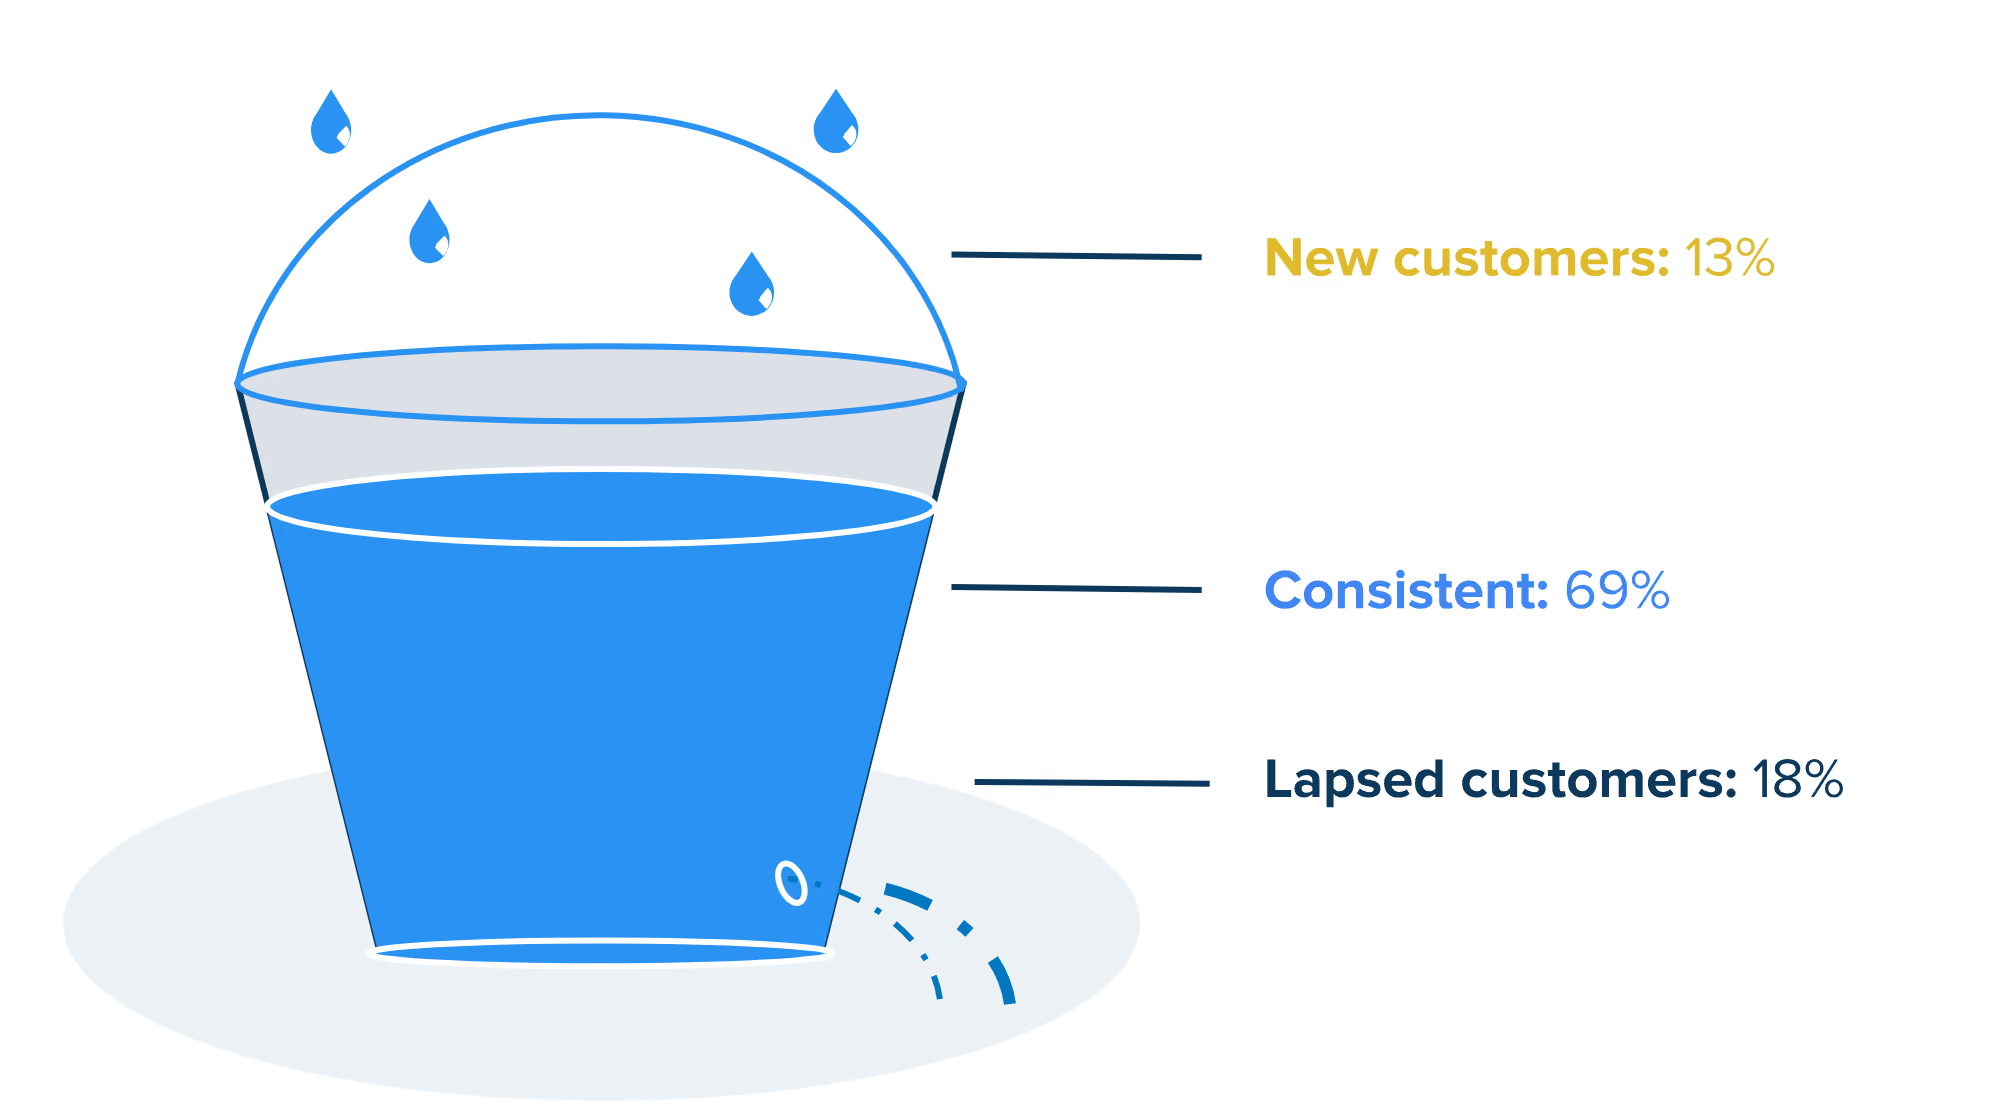
Grocery Leaky Bucket
Grocery brands are acquiring new customers yet even more existing customers are moving into the lapsed tier. This cycle can be reversed by continuing to nurture existing customers.
Diving deeper into the individual segments tells us:
- Loyal customers and those that Prefer the competition are the most rigid (with 67% and 65% staying the same, respectively). Those customers that are Tied have the greatest propensity for a behaviour change, with only 9% staying the same, showing extreme volatility.
- Loyal customers are far less likely to churn. Tied Customers are 56% more likely to churn (moving to Prefer or Lapsed) and customers that Prefer the competition are 200% more likely to churn!
Definitions of Customer Segments
Loyal Customers
Loyal: Only shop with a specific brand, or have the highest share of wallet with a given brand and relative rank is lower than all other brands in consideration set
Not Loyal Customers
Tied: Similar relative ranks to 2 or more brands regardless of share of wallet ranking
Prefer: Lower share of wallet and higher rank than other brands in their consideration set
Lapsed: Shopped historically but do not shop currently, as defined by the analysis time period
New: Shop currently but have not shopped historically, as defined by the analysis time period
Takeaways - Building Grocery Loyalty in the UK
Loyalty in the UK grocery sector is highly unstable. Only 25% of shoppers are truly loyal, yet they contribute 67% of their share of wallet (SOW) to a single merchant. Even within the top customers, 25% are still not totally loyal. Loyalty is fragile and demands ongoing effort as competition is always close by. To stay top of mind, marketers must continuously nurture relationships, understand customer needs, and offer seamless experiences. To foster loyalty with your customers, consider these recommendations:
- Implement an always-on engagement strategy to keep customers connected, regardless of purchase frequency.
- Regularly update/refine customer segments and adjust reward offers to keep them engaged.
- Use targeted campaigns to boost loyalty and revenue.
Cardlytics provides comprehensive Customer Loyalty Analysis, delivering insights into loyalty movement, churn risk, and retention strategies to help grocery brands drive long-term customer value. Contact us to learn more
* For this report, we've selected the entire Grocery category in our data, collectively representing over $200bn in annual card spend. This sample differs from the previous Customer Loyalty Analysis report.
Loyalty Movement Report: Grocery
In this Loyalty Movement Report, we’ll dive deeper into customer behavior across the Grocery category to better understand engagement over time.
Introduction
In our previous report, Redefining Customer Loyalty, Cardlytics defined loyalty as a consumer’s preference for a merchant over competitors. We analyzed $160B in spending across six industries to measure customer loyalty and spending patterns with both loyal and non-loyal customers.
But customer behavior isn’t fixed—customers shift between loyalty segments over time. Understanding these shifts helps identify churn and informs strategies to nurture relationships and move customers to higher loyalty segments. In our newest Loyalty Movement Report, we dive into customer behavior in the Grocery category to better understand engagement over time by analyzing the entire grocery category with more than $200B in consumer spend behavior.*
Grocery Category Loyal Customers
On average, 58% of a merchant’s customers are not actually loyal. But the loyal segment has a much higher share of wallet (84%) than a not loyal segment (18%).
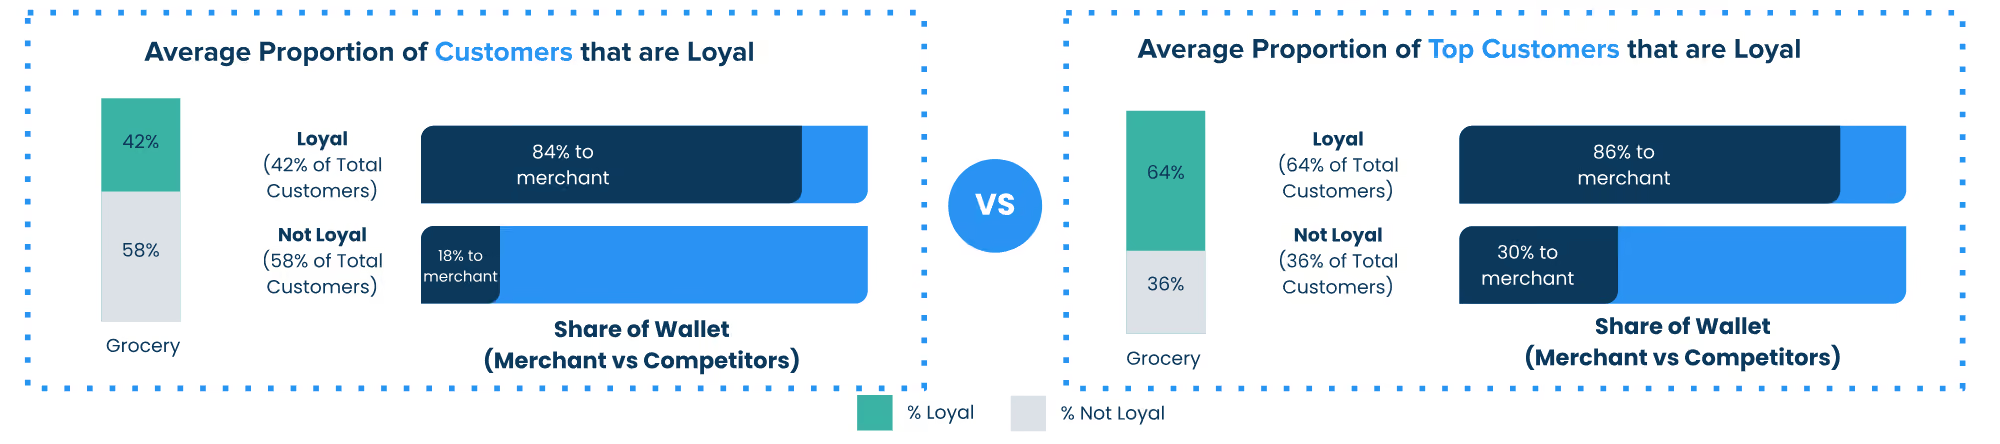
Top Customers (top 20% of most frequent transactors) still show that more than ⅓ are not loyal customers. Yet the loyal customer segment shows an almost 3x higher share of wallet.
Findings
We looked into purchase data at all groceries in the US over the last 8 quarters (Q1-23 through Q4-24) on a quarter by quarter basis to see whether even the “most loyal” customers showed changes in their purchase behavior.
Grocery Loyalty Movement
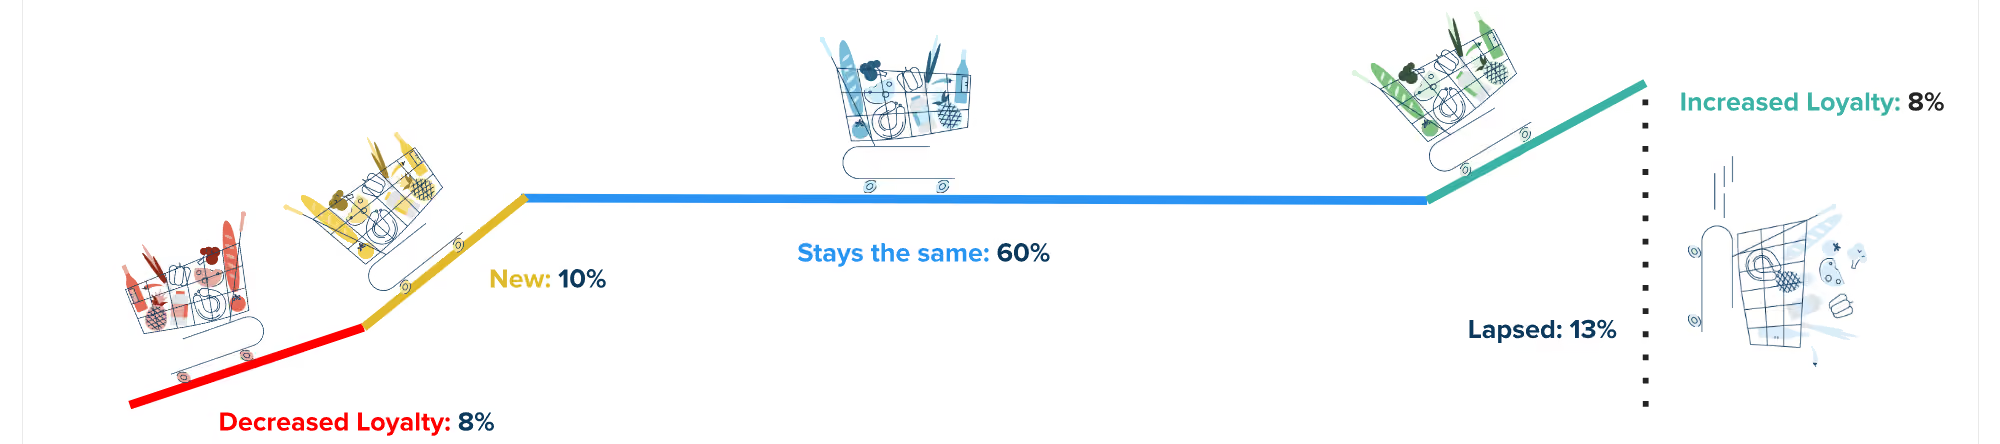
Overall, quarter over quarter, 60% of customers tend to remain in their existing segments while 40% increase or decrease their loyalty to a merchant. Yet there is much more extensive customer loyalty movement within the “not loyal” segments.
Segment Movement
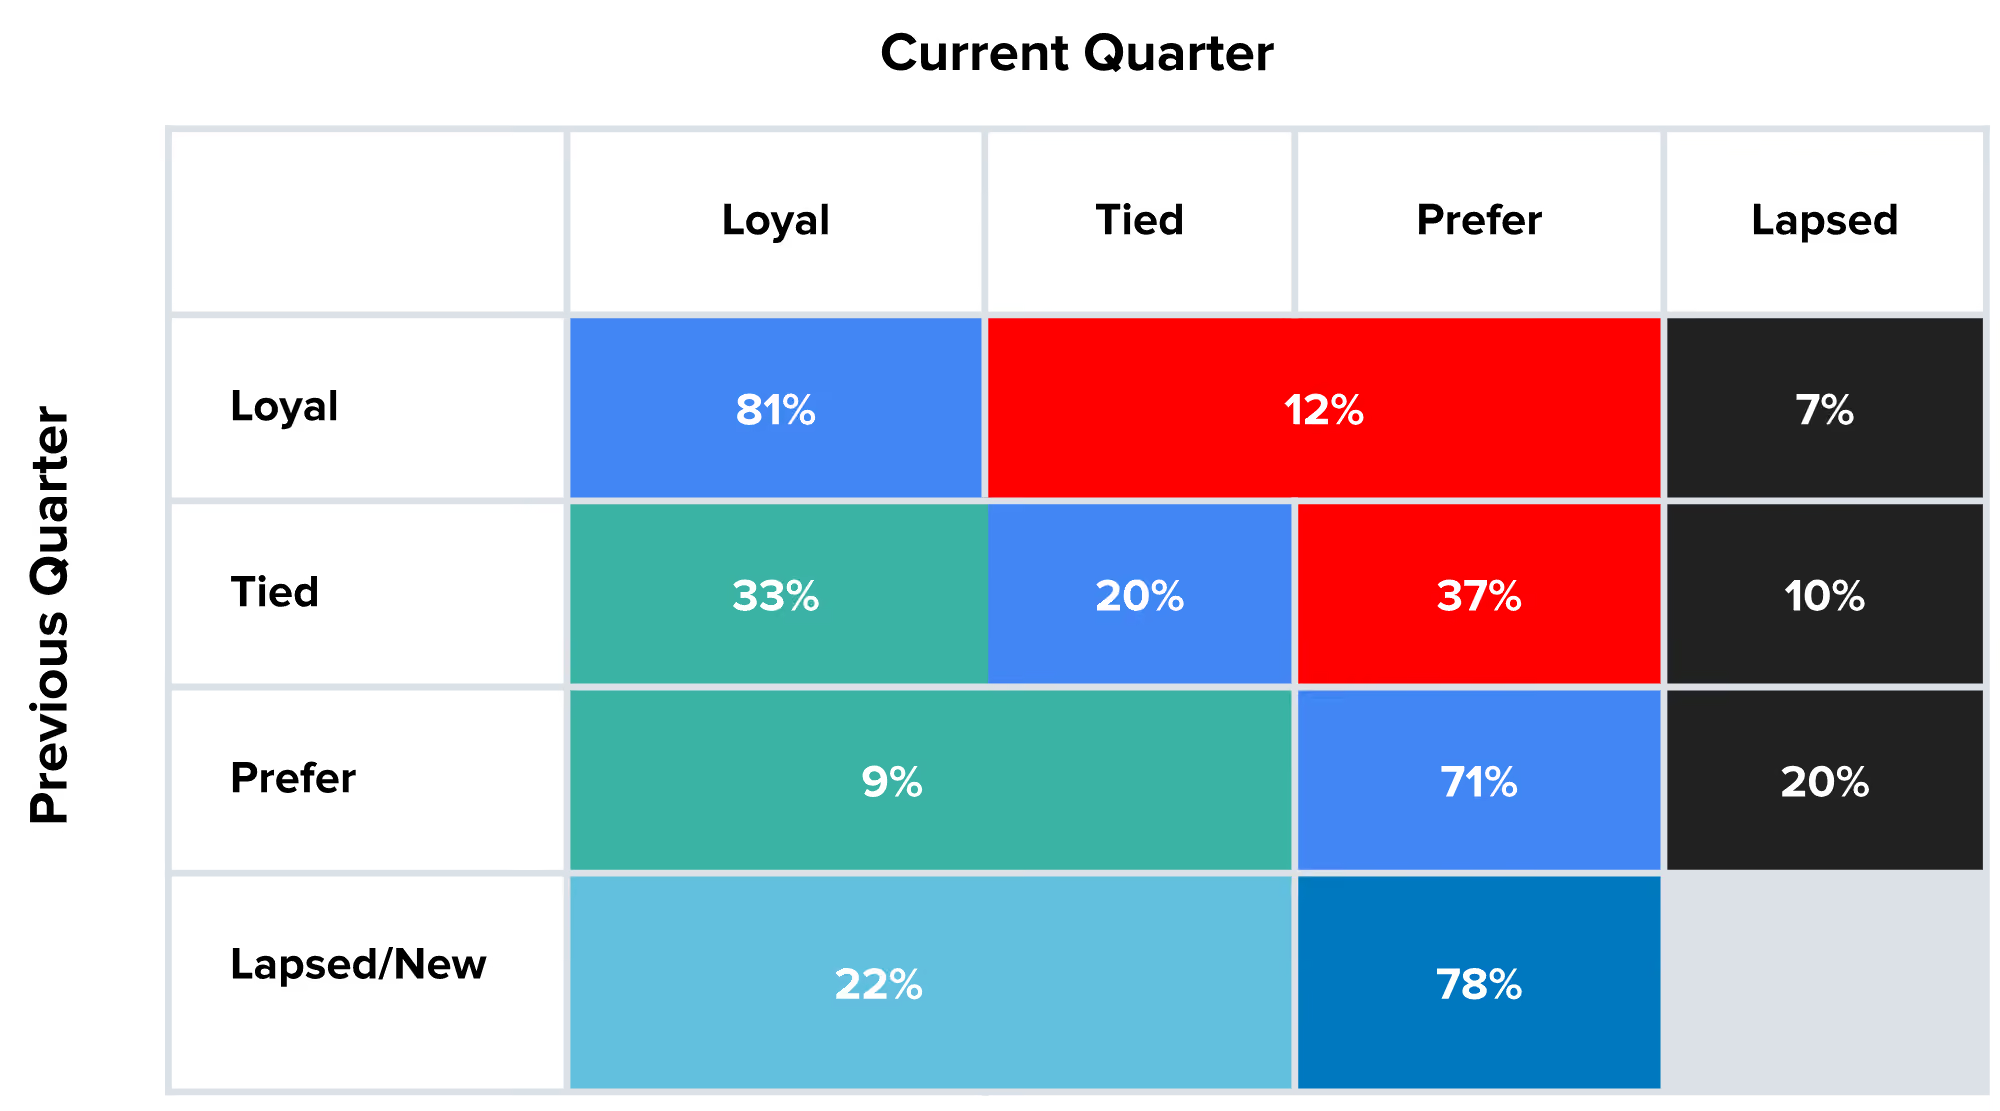
While all segments show purchase behavior movement, the Tied segment (part of Not Loyal customers) shows the most movement - both up (33%) and down (37%) - into other segments.
Grocery Leaky Bucket
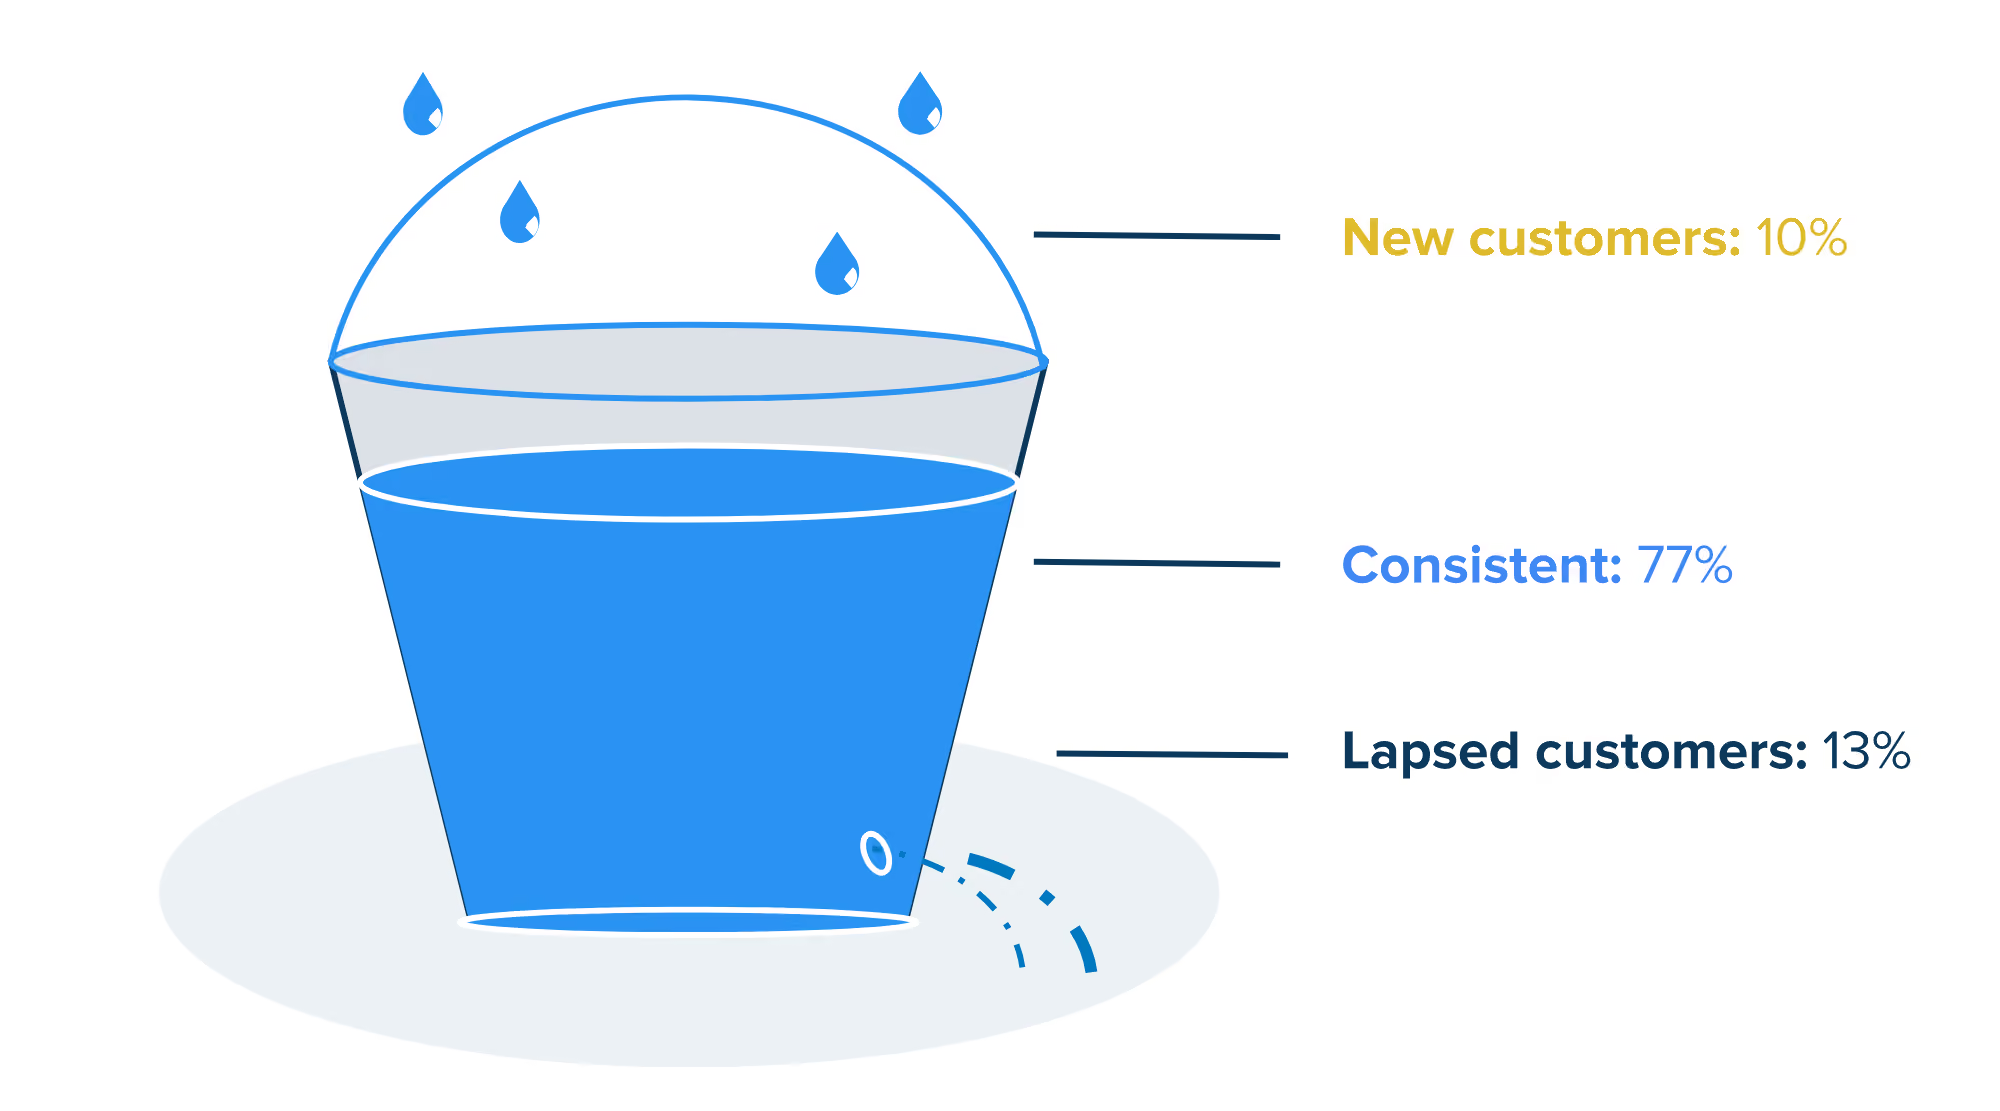
Grocery brands are acquiring new customers yet even more existing customers are moving into the lapsed tier. This cycle can be reversed by continuing to nurture existing customers.
Diving deeper into the individual segments tells us:
- Loyal customers and those that Prefer the competition are the most rigid (with 81% and 71% staying the same, respectively). Those customers that are Tied have the greatest propensity for a behavior change (with only 20% staying the same).
- Loyal customers are far less likely to churn. Customers that are Tied are 42% more likely to churn and customers that Prefer the competition are 185% more likely to churn!
Definitions of Customer Segments
Loyal Customers
Loyal: Only shop with a specific brand, or have the highest share of wallet with a given brand and relative rank is lower than all other brands in consideration set
Not Loyal Customers
Tied: Similar relative ranks to 2 or more brands regardless of share of wallet ranking
Prefer: Lower share of wallet and higher rank than other brands in their consideration set
Lapsed: Shopped historically but do not shop currently, as defined by the analysis time period
New: Shop currently but have not shopped historically, as defined by the analysis time period
Takeaways
Marketers know it’s more costly to acquire or re-acquire customers than to keep existing ones engaged. When brands neglect current customers, they risk losing them and undoing past investment - not loyal customers are 42%-185% more likely to lapse/churn than loyal customers. Loyalty is fragile and demands ongoing effort as competition is always close by. To stay top of mind, marketers must continuously nurture relationships, understand customer needs, and offer seamless experiences. To foster loyalty with your customers, consider these recommendations:
- Use an “always on” strategy to keep customers engaged, regardless of purchase frequency.
- Regularly update/refine customer segments and adjust reward offers to keep them engaged.
- Use targeted campaigns to boost loyalty and revenue.
Cardlytics can deliver a comprehensive Customer Loyalty Analysis with insights into customer behavior and movement across defined loyalty segments. Contact us for more details.
* For this report, we've selected the entire Grocery category in our data, collectively representing over $200bn in annual card spend. This sample differs from the previous Customer Loyalty Analysis report.
About Cardlytics
Cardlytics (NASDAQ: CDLX) is a digital advertising platform. We partner with financial institutions to run their rewards programs that promote customer loyalty and deepen relationships. In turn, we have a secure view into approximately 1 of every 2 card-based transactions in the U.S., allowing us to see where and when consumers are spending their money. We use these insights to help marketers identify, reach, and influence likely buyers at scale, as well as measure the true sales impact of marketing campaigns. Learn more at www.cardlytics.com.

Loyalty Movement Report: Big Box Retail
In this Loyalty Movement Report, we’ll dive deeper into customer behavior across the Big Box category to better understand engagement over time.
Big Box Retail: Stop Taking Customer Loyalty for Granted
Introduction
In our previous report, Redefining Customer Loyalty, Cardlytics defined loyalty as a consumer’s preference for a merchant over competitors. We analyzed $160B in spending across six industries to measure customer loyalty and spending patterns with both loyal and non-loyal customers.
But customer behavior isn’t fixed—customers shift between loyalty segments over time. Understanding these shifts helps identify churn and informs strategies to nurture relationships and move customers to higher loyalty segments. In our Loyalty Movement Report, we dive into customer behavior in the Big Box category to better understand engagement over time by analyzing 8 brands with more than $400B in consumer spend behavior.*
Big Box Retailer Category Loyal Customers
On average, 76% of a merchant’s customers are not actually loyal. But the loyal segment has a much higher share of wallet (70%) than a not loyal segment (15%).
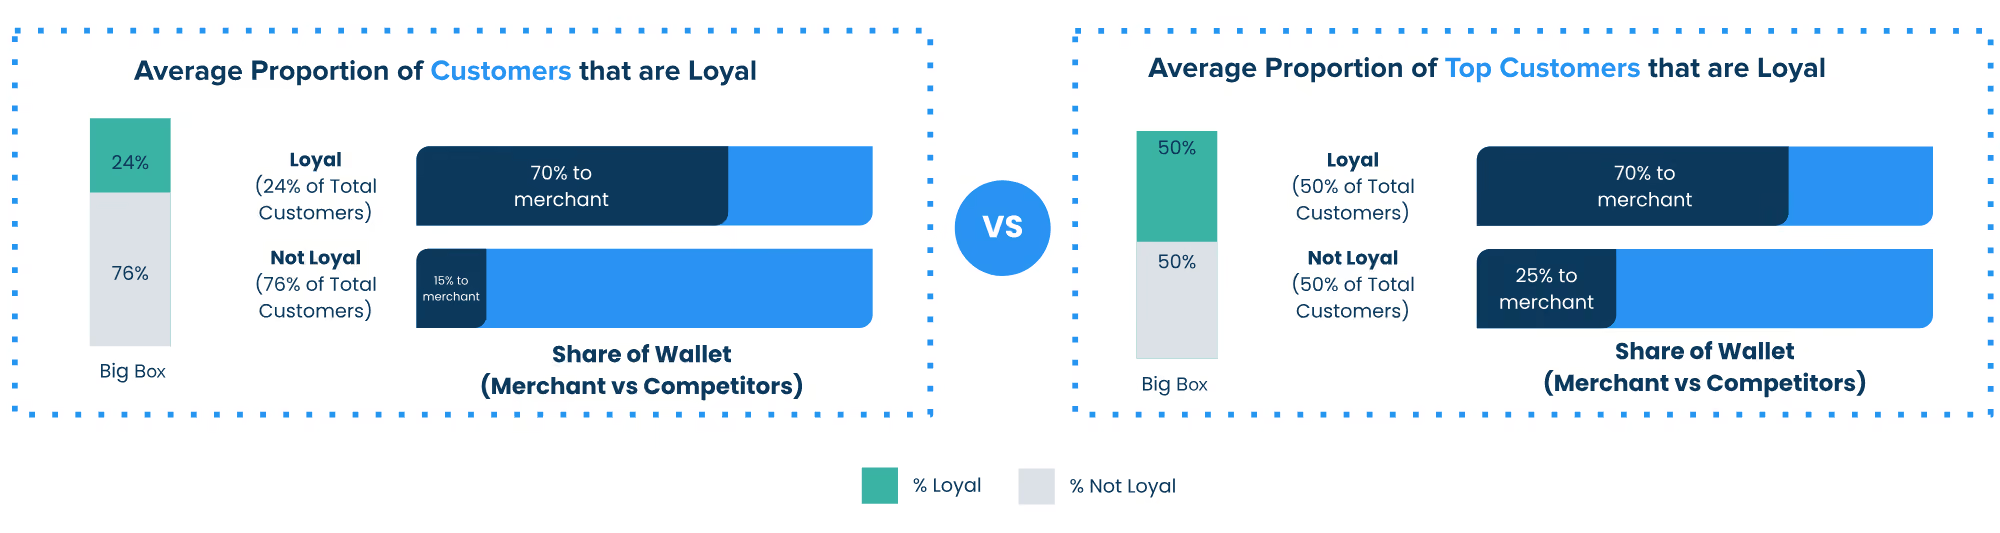
Top Customers (top 10% of most frequent transactors) are evenly split between loyal and not loyal customers. But the loyal customer segment shows an almost 3x higher share of wallet.
Findings
We looked into purchase data at 8 big box retailers in the US over the last 8 quarters (Q1-23 through Q4-24) on a quarter by quarter basis to see whether even the “most loyal” customers showed changes in their purchase behavior.
Big Box Loyalty Movement
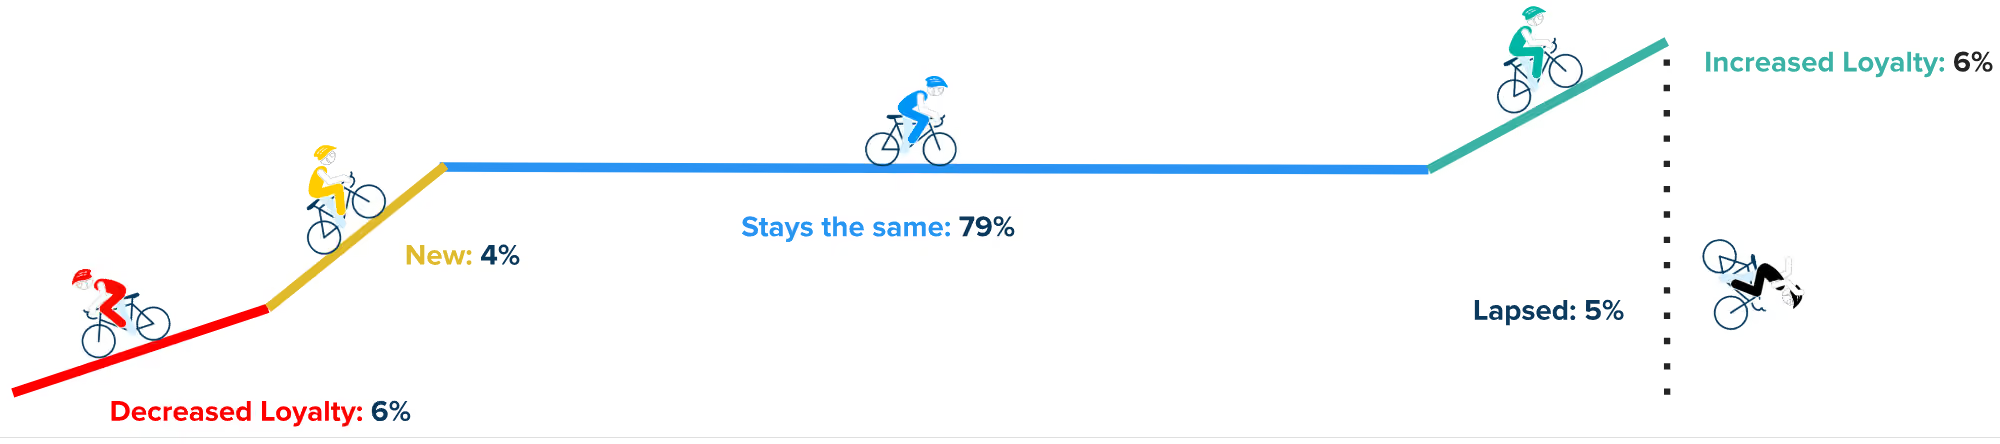
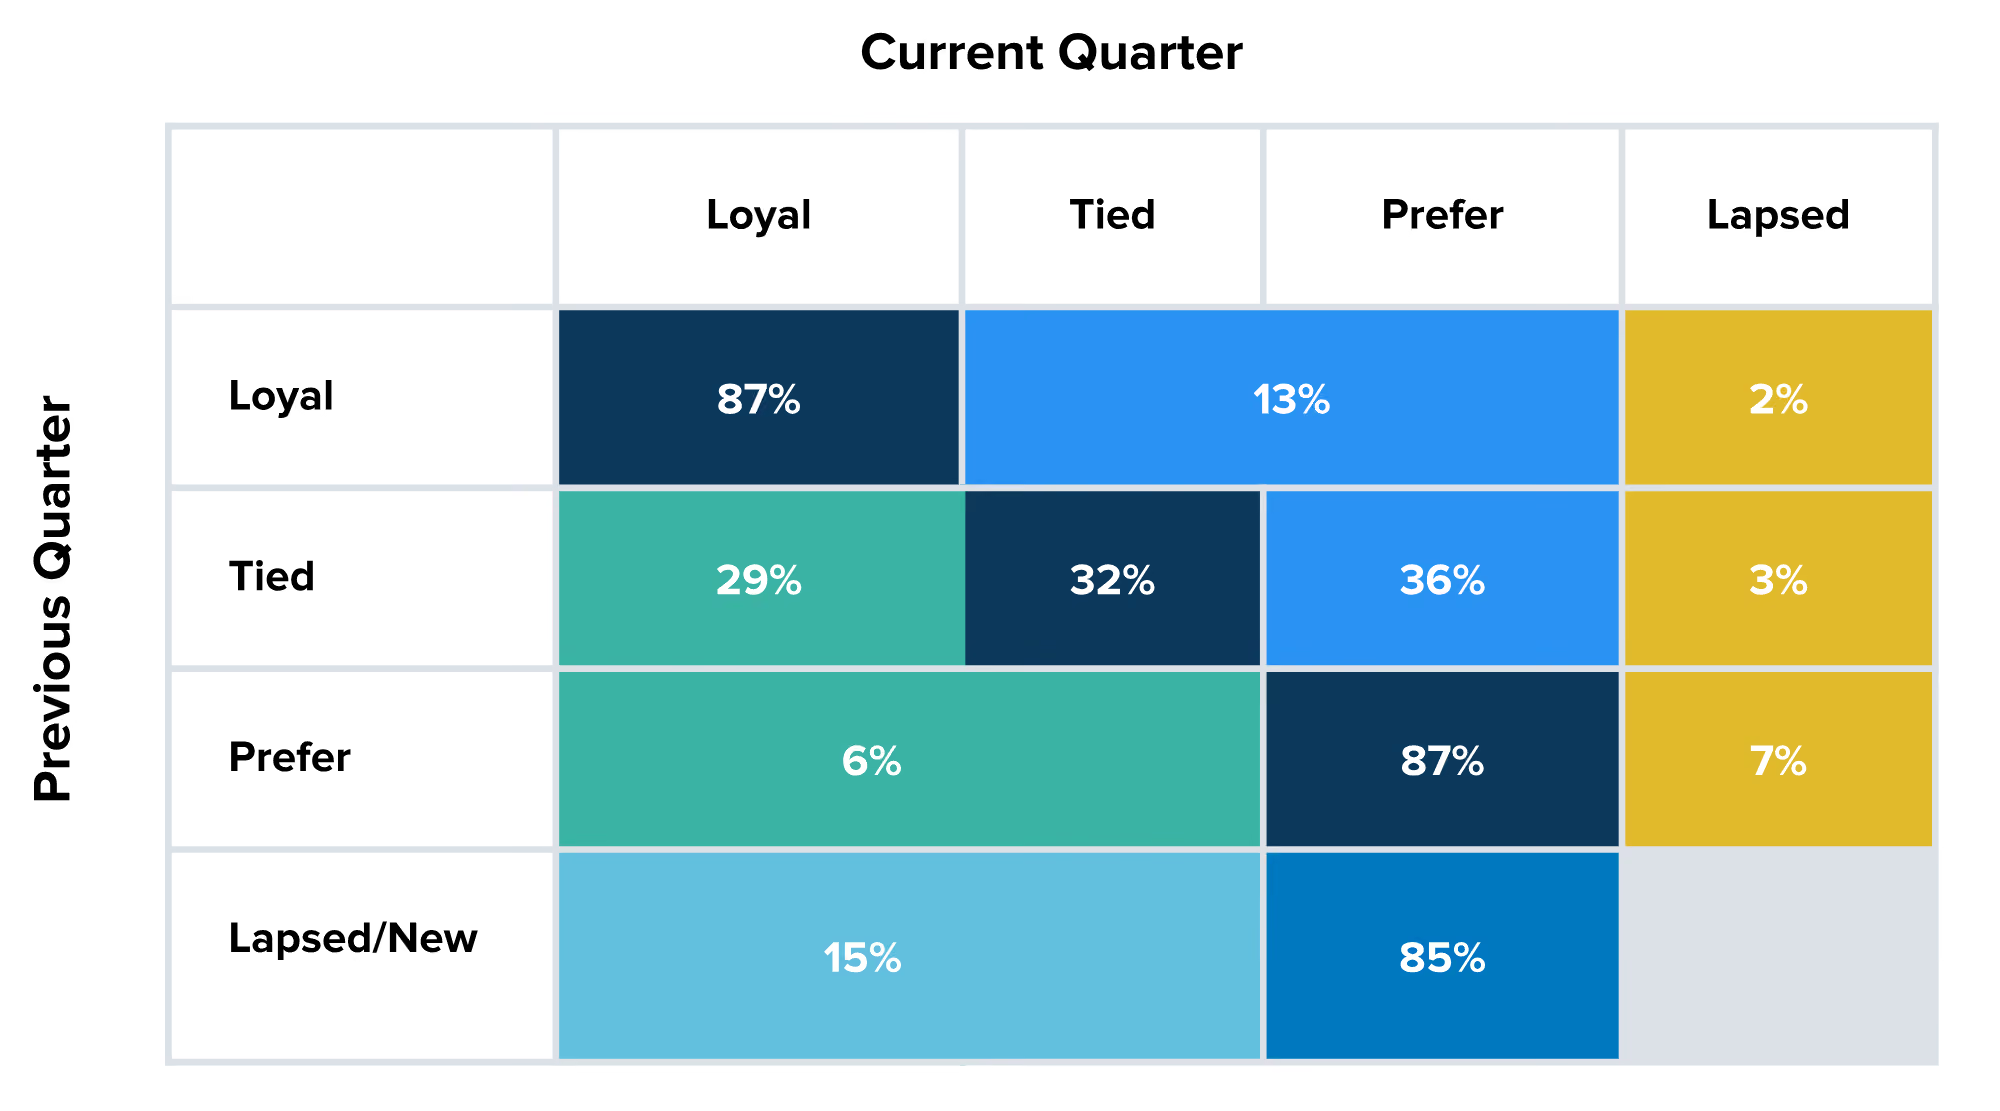
Overall, quarter over quarter, almost 80% of customers tend to remain in their existing segments while 20% increase or decrease their loyalty to a merchant. Yet there is much more extensive customer loyalty movement within the “not loyal” segments.
Segment Movement
While all segments show purchase behavior movement, the Tied segment (part of Not Loyal customers) shows the most movement - both up (29%) and down (36%) - into other segments.
Big Box Leaky Bucket
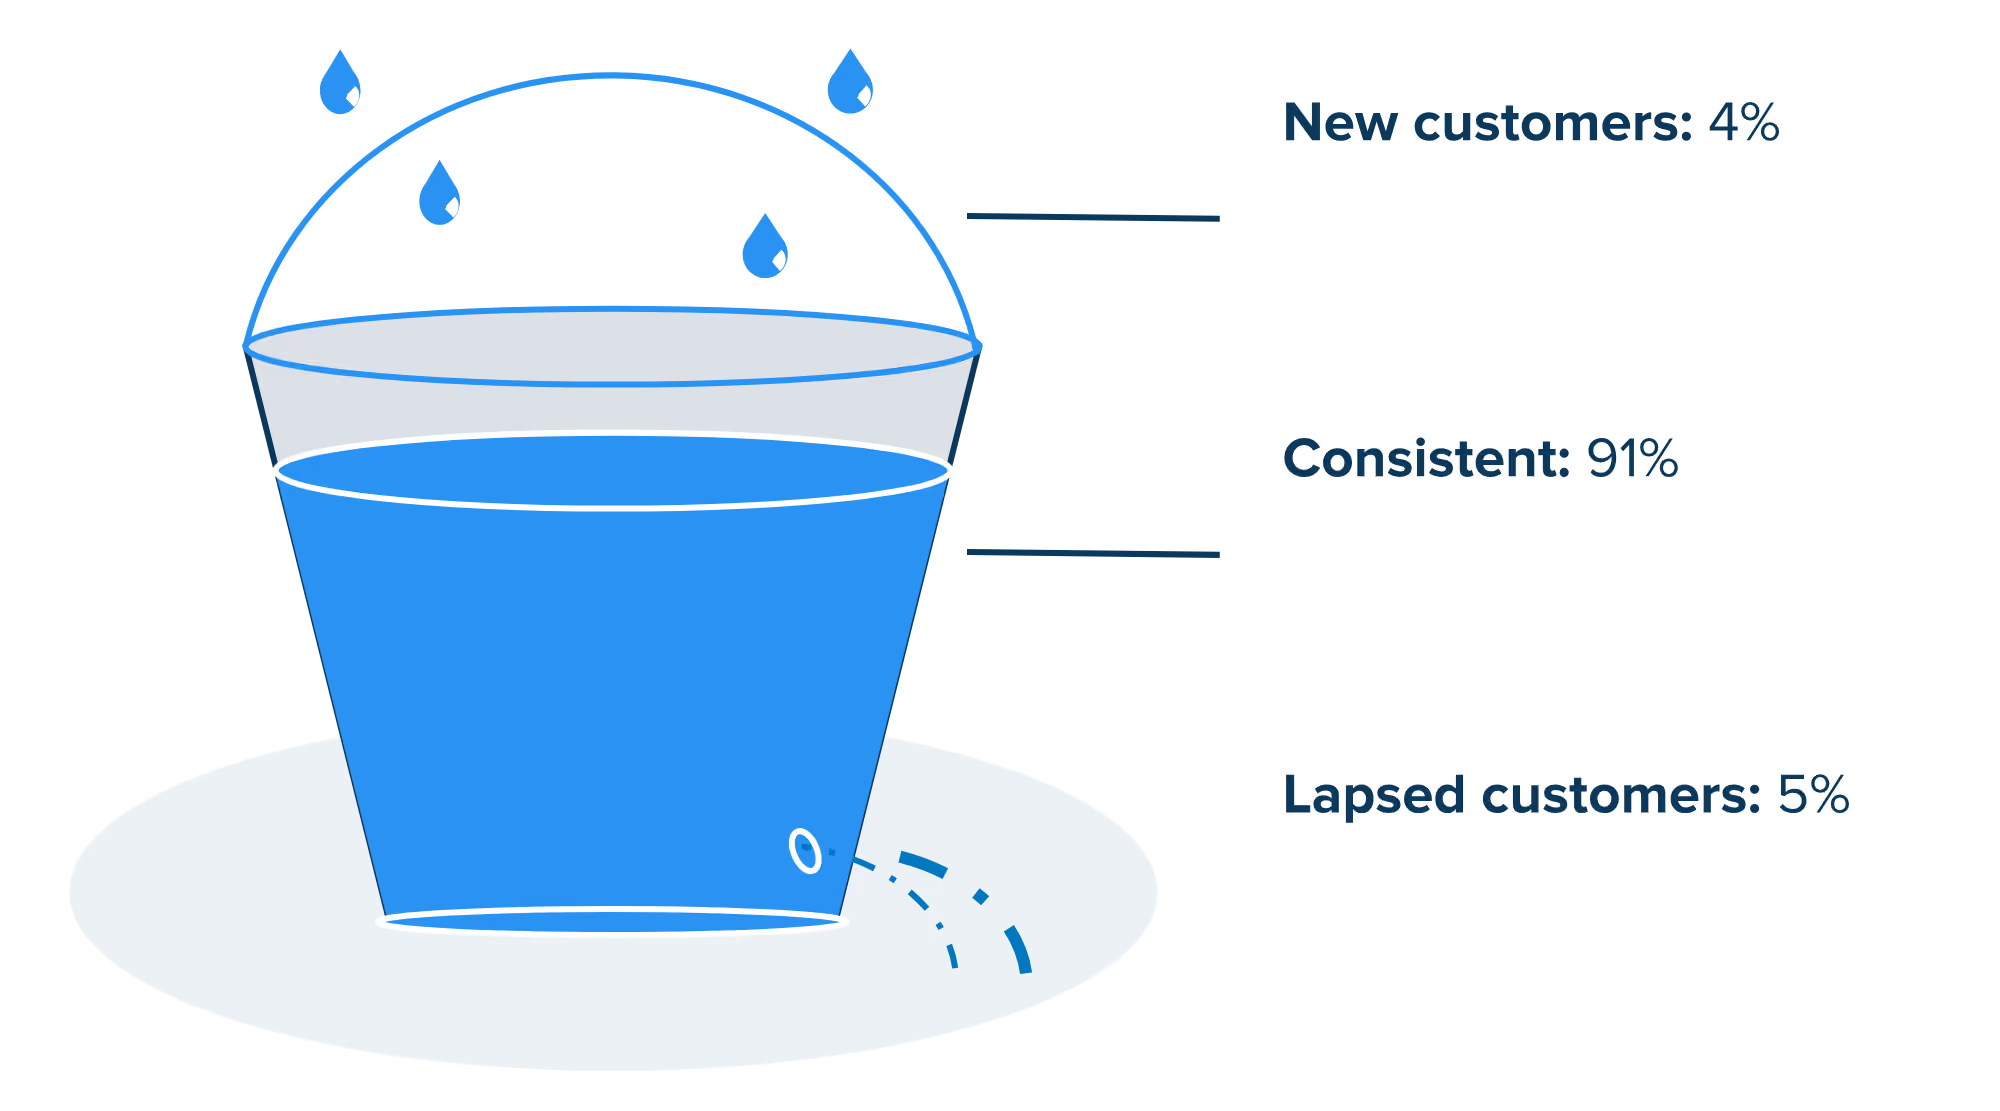
Big Box brands are acquiring new customers yet even more existing customers are moving into the lapsed tier. This cycle can be reversed by continuing to nurture existing customers.
Diving deeper into the individual segments tells us:
- Loyal customers and those that Prefer the competition are the most rigid (with 87% staying the same). Those customers that are Tied have the greatest propensity for a behavior change (with only 32% staying the same).
- Loyal customers are far less likely to churn. Customers that are Tied are 50% more likely to churn and customers that Prefer the competition are 250% more likely to churn!
Definitions of Customer Segments
Loyal Customers
Loyal: Only shop with a specific brand, or have the highest share of wallet with a given brand and relative rank is lower than all other brands in consideration set
Not Loyal Customers
Tied: Similar relative ranks to 2 or more brands regardless of share of wallet ranking
Prefer: Lower share of wallet and higher rank than other brands in their consideration set
Lapsed: Shopped historically but do not shop currently, as defined by the analysis time period
New: Shop currently but have not shopped historically, as defined by the analysis time period
Takeaways
Marketers know it’s more costly to acquire or re-acquire customers than to keep existing ones engaged. When brands neglect current customers, they risk losing them and undoing past investment - not loyal customers are 50%-250% more likely to lapse/churn than loyal customers. Loyalty is fragile and demands ongoing effort as competition is always close by. To stay top of mind, marketers must continuously nurture relationships, understand customer needs, and offer seamless experiences. To foster loyalty with your customers, consider these recommendations:
- Use an “always on” strategy to keep customers engaged, regardless of purchase frequency.
- Regularly update/refine customer segments and adjust reward offers to keep them engaged.
- Use targeted campaigns to boost loyalty and revenue.
Cardlytics can deliver a comprehensive Customer Loyalty Analysis with insights into customer behavior and movement across defined loyalty segments. Contact us for more details.
* For this report, we've selected a sample of 8 of the largest merchants including a mix of online marketplaces, memberships and omni-channel retail, collectively representing over $400bn in annual card spend. This sample differs from the previous Customer Loyalty Analysis report.
About Cardlytics
Cardlytics (NASDAQ: CDLX) is a digital advertising platform. We partner with financial institutions to run their rewards programs that promote customer loyalty and deepen relationships. In turn, we have a secure view into approximately 1 of every 2 card-based transactions in the U.S., allowing us to see where and when consumers are spending their money. We use these insights to help marketers identify, reach, and influence likely buyers at scale, as well as measure the true sales impact of marketing campaigns. Learn more at www.cardlytics.com.
Get our insights delivered to you
Stay up to date. Subscribe now.