Identify opportunity
Advertisers can learn about their brand, their customers and their competitors, through comprehensive dashboards powered by Cardlytics’ purchase intelligence.


Real insights from real bank customers
Discover how Cardlytics Purchase Intelligence empowers marketers with actionable insights from over 215 million bank customers. By analyzing real, anonymized transaction data, our self-serve dashboards reveal where, when, and how people spend—giving you a competitive edge to better understand your customers, your brand, and your market. From customer loyalty trends to geographic spend patterns and competitor performance, Cardlytics turns data into results-driven strategy.
Our Purchase Intelligence is built on customer transaction data

Where they buy
- The merchant
- The industry & category
- The channel they buy from
- The store’s location

When they buy
- The exact time and day
- How recently
- How frequently
- The season

How much they spend
- The transaction amount
- The merchant’s share
- Customer spending patterns
- Customer loyalty
The Cardlytics Insights Portal: Data-Driven Understanding
Deeply understand your brand, your customers and your competition through the Cardlytics Insights Portal - a self-serve portal with comprehensive dashboards powered by Cardlytics purchase intelligence.
.webp)
Market Summary
Explore brand and category growth across purchase channels
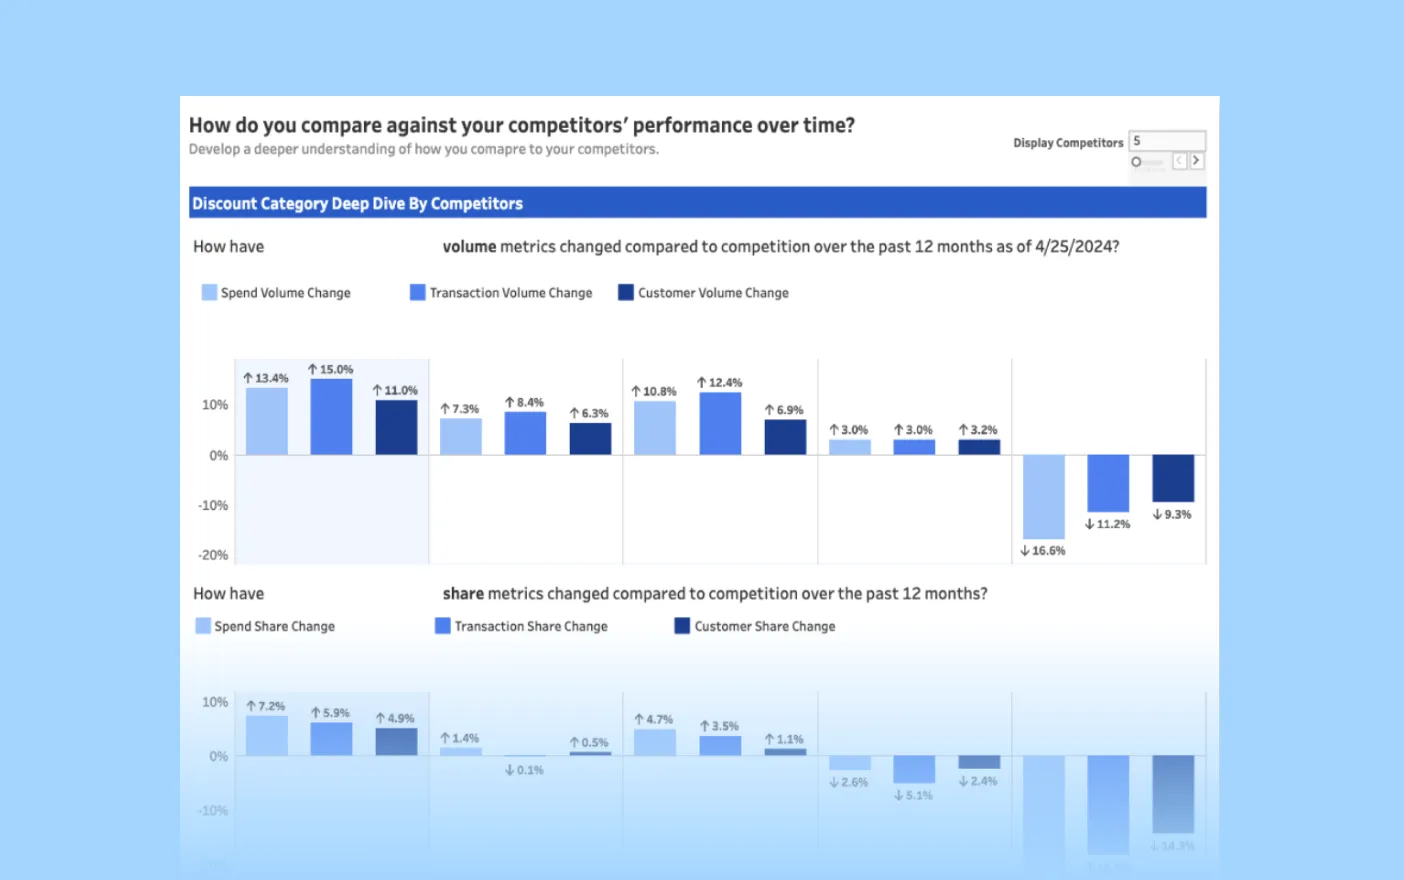
Competitor Insights
See growth and volume trends from named competitors across industries
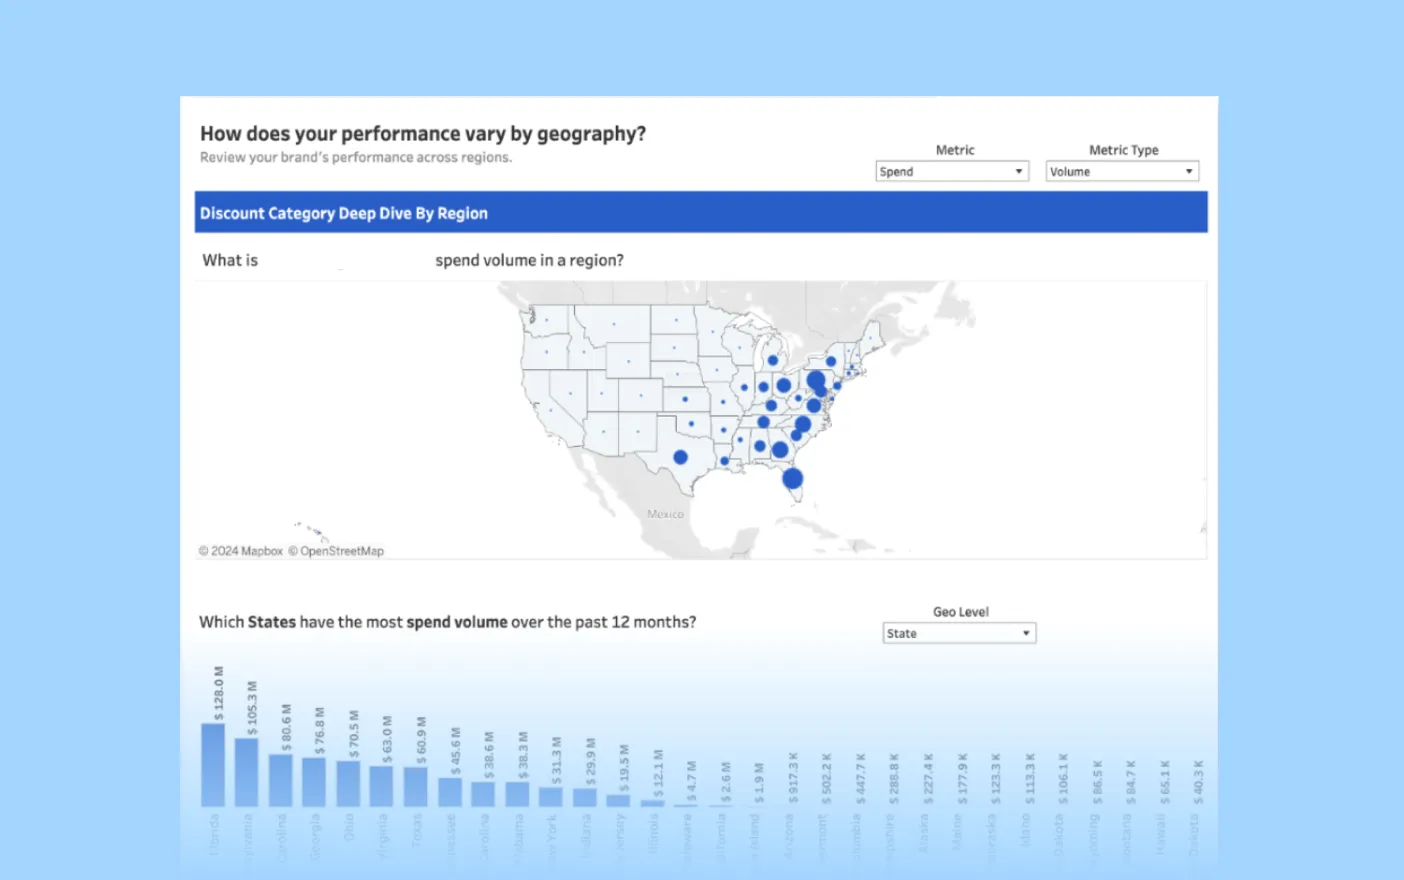
Geographic Insights
View regional spend and competitive comparisons on a state or DMA level
.webp)
Brand Affinity
Identify partnership opportunities with customer brand affinity data to elevate your brand's reach and impact
.webp)
Customer Migration
A dynamic understanding of your customer’s flow to enhance acquisition and minimize churn
.webp)
Loyalty Insights
Maximize customer retention strategies with visibility into valuable loyalty segmentation
Link insights to actionable marketing strategies
Cardlytics Purchase Intelligence is the foundation of all our campaigns. Powered by deterministic purchase data, our card-linked solutions engage targetable audiences to drive online and in-store purchases while measuring performance down to the penny.


“Because of the strong ROI and precise targeting, Cardlytics stands out from other programs that we’ve used in the past. They ultimately deliver more value than other partners.”
Daniel Lane
Director of Retail Marketing, Clarks

REACH REAL PEOPLE
Card-linked offers inspire action by delivering value where it counts
Bot's don't have bank accounts. Our brand-safe, fraud-free platform connects real shoppers with meaningful offers, providing value at the perfect moment and turning intent into action.
72% of consumers prefer brands offering card-linked rewards.
68% are influenced by higher rewards on featured products or categories.
60% see increased value in card-linked offers during financial uncertainty.
MEASURE RESULTS
See the true impact of your campaigns
Cardlytics combines first-party transaction data with powerful analytics to help you measure the incremental impact of your campaigns. See the full picture with omni-channel reporting that ties online and in-store performance directly to ROI or ROAS.
Proven with a rigorous test vs. control methodology, our results deliver measurable incremental sales. Independent verification from Nielsen Sales Lift Measurement and seamless integration with Media Mix Models (MMM) ensure you can trust and act on the insights.

Research & Insights
View all


Four signals from a shifting wallet — and what they mean for advertisers.
UK consumer spending looks healthy on the surface. Look closer, and the wallet is quietly diverging.
New analysis from Cardlytics, drawing on UK purchase data across more than 60 million enabled accounts, shows positive year-on-year spend growth across every macro category in H1 2026. But transactions, customer counts, and basket sizes tell a very different story underneath.
Consumers are protecting holidays, paying more for fewer nights out, and trading down on the high street.
Three shifts leaders shouldn't ignore
Holidays held, but restaurants didn't. Hospitality lost 3.83% of transactions year-on-year in H1; Nightlife lost 3.95%. Travel grew 0.97% in Q1, with Entertainment & Leisure up 6.16%.
Inflation is doing the heavy lifting on the high street. Hospitality, Nightlife, and Everyday Conveniences all posted positive spend growth — but only because average ticket value rose around 5%. Real visit frequency is falling.
Retail is winning volume and losing value. Non-Essential Retail transactions rose 6.09% in H1 while average basket size fell 4.15%. Consumers are shopping more often and spending less per basket — a clear discount-led signal.
Spend and transactions tell two different stores
Unlock the full Q2 State of Spend report
Top-line growth is masking a structural pullback in mid-week dining, a narrowing active customer base, and a discount-driven retail shift. Download the full report for the category-by-category breakdown and the four advertiser playbooks for an uneven wallet.
Inside the report:
- The "Who Is Losing?" Index: How six macro categories really performed once ATV inflation is stripped out.
- The Hospitality & Nightlife Squeeze: Why footfall is down ~4% even as spend ticks up.
- The Retail Paradox: Record transaction frequency colliding with shrinking baskets.
Four Playbooks for Advertisers: Where to drive frequency, where to grow basket size, and where loyalty beats acquisition in Q3.

From loyalty to relevance: Why personalised rewards matter more than ever for UK banks
UK consumers may feel loyal to their bank, but that loyalty is increasingly conditional.
New research from Cardlytics, based on a nationally representative survey of 4,000 UK adults, shows that while most customers are not actively planning to switch, many are open to reassessing where they bank when the value is clear.
Two thirds of consumers (65%) say they feel loyal to their main bank, and 60% say they are unlikely to switch in the next 12 months. But that stability should not be mistaken for permanence. More than half (57%) have switched their main bank account at some point as an adult, and many now spread their money across more than one provider.
The result is a banking market where retention is no longer just about keeping customers from leaving altogether. It is about staying relevant in more of their everyday financial decisions.
Trust and service still matter, but they are now the baseline
When asked what keeps them with their current bank, UK consumers are most likely to cite good customer service (40%), brand trust and reputation (35%), and the quality of mobile or online banking (32%).
These are the foundations of a strong banking relationship. They help explain why customers stay put, particularly older generations. For example, Baby Boomers are significantly more likely to say customer service is a key reason they stay with their bank (50%).
But these factors are increasingly expected. They are essential to retention, but on their own they may be less effective at creating real competitive advantage.
Unlock the full Cardlytics Banking Index 2026
The shift from passive loyalty to active relevance is changing how the UK banks. To read the full analysis on how financial value triggers action, the impact of personalised rewards on 18 to 34 year olds, and why loyalty is no longer exclusive, download the complete report below.
Get the full insights to discover:
- The Switching Triggers: The specific financial incentives driving 25% of Gen Z to reconsider their bank.
- The Personalisation Opportunity: How tailored rewards can increase retention by up to 55% for key demographics.
- The Visibility Challenge: Why 22% of customers are unaware of the rewards their banks already offer.
- Multi-banking Trends: Why customers are spreading their finances and how to capture a greater share of wallet.

Where have all the shoppers gone?
How UK shoppers are narrowing their choices — and what it means for growth
After two years of post-pandemic recalibration, UK consumers are still spending. But they are becoming more selective in where, when and why they do so.
Cardlytics’ latest State of Spend report draws on first-party purchase data from 23 million UK bank customers across the spring and summer period.
What it shows is simple: retail growth remains present, but increasingly uneven. Categories that feel essential, convenient or low-risk continue to attract spend. More discretionary and deferrable purchases are coming under greater pressure.
This is less a story of demand disappearing and more one of decision-making narrowing. For retailers and brands, growth will depend less on broad consumer momentum and more on securing a place in a smaller set of deliberate purchasing moments.
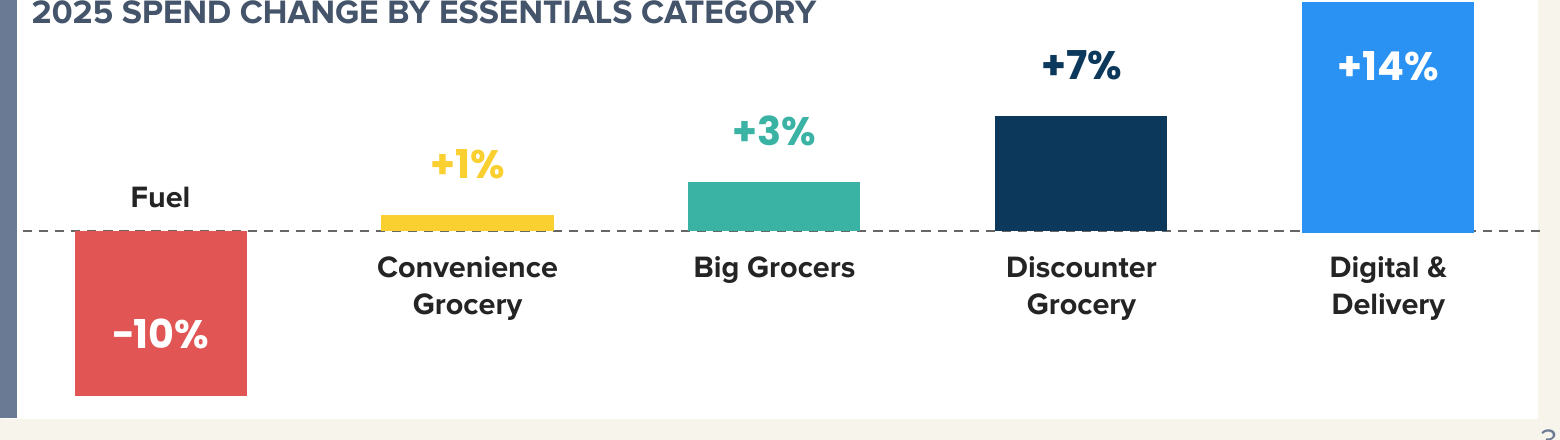
Essentials: fewer trips, tighter control
Essential categories remain the most resilient part of the market. But the pattern of spending suggests households are becoming more deliberate in how they manage everyday needs. Growth is still there — it is just concentrated in channels that offer either convenience at scale or a clearer sense of value.
The strongest performance continues to come from Digital & Delivery Grocery, where spend rose 17% in 2024 and 14% in 2025. Transactions also grew strongly, pointing to a channel still benefiting from continued adoption and slightly larger baskets.
Discounter Grocery shows a similar pattern, with spend up 9% in 2024 and 7% in 2025, supported by steady transaction growth. The category continues to act as a dependable value channel for households managing budgets carefully.
Among Big Grocers, growth is more subdued — 6% in 2024, slowing to 3% in 2025 — while transactions moved broadly flat. Spending is being held up by larger baskets rather than more visits. Convenience Grocery has come under greater pressure still, with trips down around 3%.
Fuel is the clearest sign of retrenchment within essentials. Spend declined 5% in 2024 and 10% in 2025, with early 2026 data indicating this behaviour is continuing.
Cardlytics analysis
Essential spend is still being protected, but the shape of that spend is changing. Consumers are concentrating everyday purchasing into channels that help them feel organised or in control — whether that’s delivery-led convenience or discounter-led value.
For marketers, the opportunity is less about generating additional need and more about intercepting planned purchase moments with a clear reason to choose one retailer or brand over another. In a market where fewer shopping occasions carry more weight, securing a greater share of each visit matters more.
Retail: a resilient base, but narrowing engagement
Retail continues to grow — but that growth is becoming more uneven. The strongest performance is increasingly concentrated in categories that feel accessible, repeatable or easy to justify. Traditional and aspirational areas are finding it harder to sustain engagement.
Make-up & Beauty remains one of the clearest areas of resilience. Spend rose 11% in 2024 and 8% in 2025, with transactions also moving in the right direction. It’s one of the few categories where shoppers still see room for smaller, more manageable discretionary purchases.
Online Fast Fashion continues to expand, up 14% and 9% across the two years, though baskets have softened slightly — shoppers engaging more frequently but with tighter control on basket size. Marketplaces are another strong area of growth, reinforcing their role as a flexible, value-conscious route to purchase.
Elsewhere, the picture tightens. High Street Fashion growth has slowed and transactions have flattened. Department Stores saw spend fall 3% in 2024 and 4% in 2025, pointing to an ongoing footfall challenge. And Luxury / Designer Fashion spend declined 6% in 2024 and 8% in 2025 — purchases are still happening, but among fewer shoppers, less often.
Cardlytics analysis
The categories still growing are not necessarily those with the strongest brand pull. They are the ones most aligned with how consumers want to shop now: flexibly, frequently and with lower perceived risk.
For brands, that raises the importance of relevance, value communication and mission-based targeting over broader assumptions about seasonal demand. In a more selective market, success will depend less on broad visibility alone and more on giving shoppers a clear, immediate reason to engage.
Household: from upgrade to upkeep
Across home-related categories, the shift from 2024 into 2025 points to a more cautious consumer mindset. Spending hasn’t disappeared — but households are more willing to maintain and replace than to embark on larger, more discretionary home purchases.
Value Homeware has remained relatively stable, up 9% in 2024 and 5% in 2025. High Street Furniture shows a clearer slowdown, moving from 6% growth to 2%, with spend concentrating in fewer, higher-value occasions.
The pattern is more pressured in DIY. After 3% growth in 2024, spend moved into a 2% decline in 2025, with transactions down around 5%. Electricals follow a similar trajectory — from 4% growth to a 1% decline — with purchases increasingly concentrated in fewer, more considered buying moments.

Cardlytics analysis
In home-related categories, demand increasingly looks tied to maintenance, replacement and justified necessity rather than inspiration or upgrade. That changes what effective messaging looks like.
Brands here may need to focus less on aspiration and more on practicality, durability and timely relevance if they want to convert consumers who are clearly weighing whether a purchase can wait. The strongest opportunities come from moments where need is immediate and the value exchange is clear.
Wider discretionary: where the drop-off is most visible
The clearest signs of pressure appear outside the core retail categories — in areas where spending is most optional and easiest to postpone. Here the challenge is not how much consumers spend when they engage, but whether they enter the category at all.
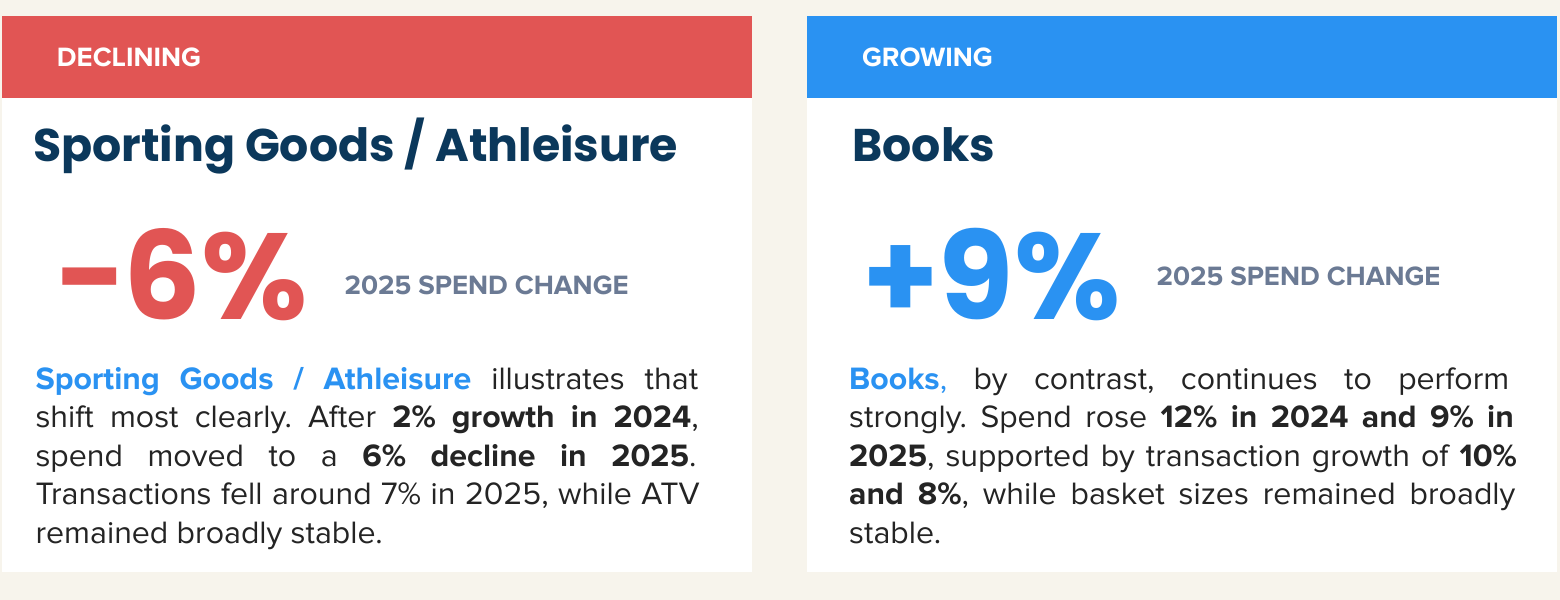
Sporting Goods / Athleisure illustrates the shift most clearly. After 2% growth in 2024, spend moved to a 6% decline in 2025, with transactions down around 7% while ATV stayed broadly stable. The pressure is being driven by fewer shoppers choosing to participate — not by smaller baskets.
Books, by contrast, continues to perform strongly, up 12% in 2024 and 9% in 2025. It remains one of the clearest examples of a discretionary category where engagement holds up — consumers are still willing to spend where purchases feel lower-cost, familiar or easy to justify.
The issue is no longer simply whether shoppers can spend, but which categories still make the cut.
Cardlytics analysis
For discretionary categories, the core challenge is re-engagement. When consumers are reducing the number of optional purchases they make, brands need stronger triggers to prompt participation in the first place.
That may mean leaning harder into immediacy, occasion-based relevance, perceived value or more functional reasons to buy — rather than assuming promotions alone will unlock demand. Growth depends less on broad category momentum and more on giving consumers a compelling reason to opt in at all.
Looking ahead into 2026
Early 2026 performance is already pointing to where the narrowing of shopper demand is concentrating. Online pharmacy revenue is driving Beauty category growth. Health & wellbeing FMCG is up against overall category decline. Electronics AOV is rising on accessories, PC and gaming. And Paint & Home Furnishings are rising even as DIY declines — a clear signal that the channel and use-case shifts identified in this report are continuing.

Fewer decisions, higher stakes
The summer shopper has not disappeared, but the number of decisions they appear willing to make has narrowed.
Across the market, the strongest performance is coming from categories that feel essential, convenient or easy to justify, while more deferrable and aspirational purchases are facing greater pressure. That does not point to a collapse in consumer demand — it points to a consumer mindset that is becoming more selective about where spending feels worthwhile.
For retailers and brands, that creates a more competitive environment. Growth is no longer just about being present at the point of purchase — it is about being relevant enough to be included in a smaller set of deliberate decisions. In that context, value, timing and clarity matter more, particularly in categories where engagement can no longer be taken for granted.
How marketers should show up
01. Protect existing shoppers first
Shoppers don’t leave in one move — they drift. Transaction data already shows who’s slipping. Reaching a lapsed shopper around their next likely need window is cheaper than finding a replacement, and more effective than broad re-acquisition.
02. Growth sits in small, repeat purchases
The categories still expanding are the ones where the purchase feels small, familiar and easy to justify. Find the version of your product that fits a smaller, more frequent moment — something a shopper says yes to without deliberation.
03. Solve for participation, not basket size
The harder question isn’t what a shopper spends when they show up — it’s whether they show up at all. Discounting rarely pulls someone into a category they’ve stepped out of. An immediate, tangible need does.
The brands best placed to outperform will be those that understand which purchase moments consumers still prioritise — and can show up in those moments with a clear and compelling reason to buy.
Talk to Cardlytics about how purchase intelligence and card-linked offers can help your brand secure a place in a smaller, more deliberate set of consumer decisions — www.cardlytics.com
Get in touch
Need additional information or have a question? Tell us a little bit more and we’ll respond shortly.