Customer Loyalty
Discover why customer loyalty is key to the success of your business, how to gain brand advocates, and how to measure the impact of having loyal customers



Insights Report: Redefining Customer Loyalty
Cardlytics has access to $4.7Tn in omni-channel annual card spend, powered by the largest financial institutions in the United States. We have sampled this rich dataset to provide a full-category view of spend that sheds insight on what it really means to be brand-loyal, and how marketers can redefine audiences to make informed, strategic decisions.
Redefining Customer Loyalty
Introduction
Brands of all sizes know that engaging loyal customers is critical to their business, but how do they know which customers are loyal? Most marketers use first party transaction data to assess how often their customers are shopping or how much they are spending in order to define who their loyal customers are. This approach can lead to an inaccurate view of loyalty because it overlooks whether these customers are spending with competing brands.
Cardlytics has access to $4.7Tn in omni-channel annual card spend, powered by the largest financial institutions in the United States. We have sampled this rich dataset to provide a full-category view of spend that sheds insight on what it really means to be brand-loyal, and how marketers can redefine audiences to make informed, strategic decisions.
Read on to explore the full report (or download it here) and reach out today to get a custom brand-level view of your business’ loyal customers in relation to the category.
Key Takeaways from the Report
Significant potential exists to grow revenue by boosting customer loyalty and increasing their share of wallet.
- 10% of customers are loyal, spending 62% of their budget with the merchant.
- 90% are not loyal, spending only 9% of their budget with the merchant.
- Brands could benefit from 6.9x customer spend by focusing on the 90% of non-loyal customers
Transaction frequency doesn't equate to loyalty.
- Only 50% of a merchant's top shoppers are loyal.
- 48% of a merchant's top shoppers spend 79% of their budget with competitors.
Customer Loyalty & Share of Wallet
Defining Customer Loyalty
Cardlytics defines customer loyalty based on a consumer’s preference for a merchant relative to the competition. In this report, we’ve sampled $160Bn of spend across six large categories to determine what percentage of a merchant’s customers are loyal and how much are those customers spending with the competition as compared to customers that are not loyal.
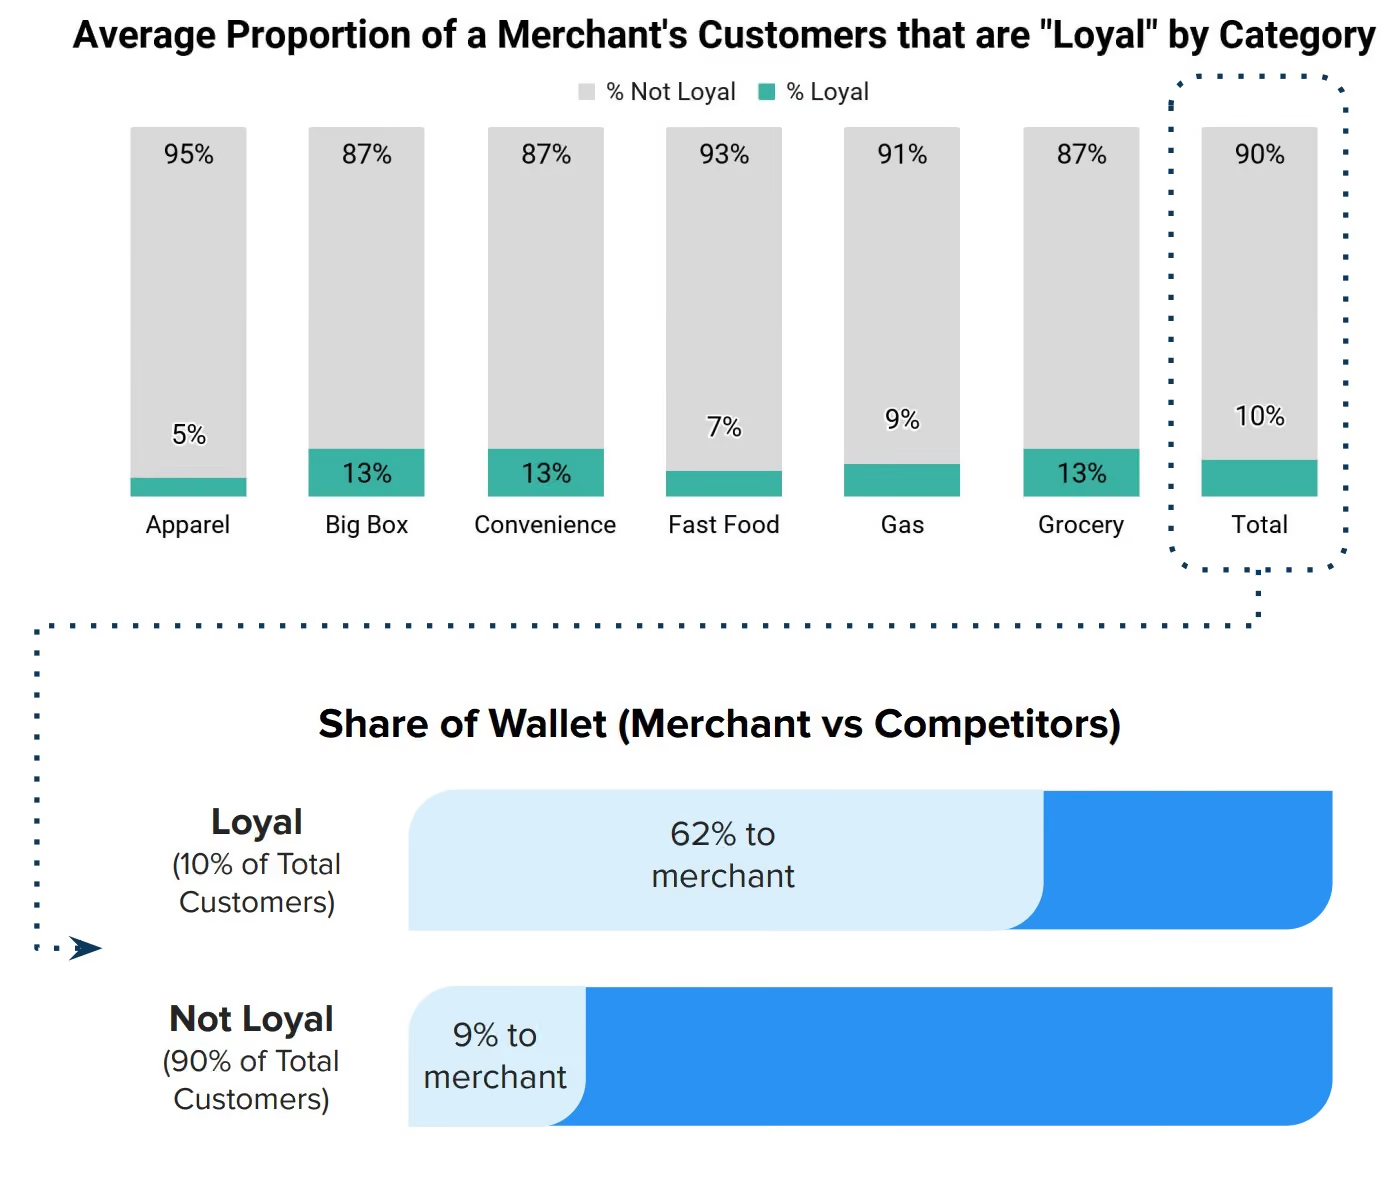
On average, 10% of a merchant’s customers are loyal (ranging from 5-13% depending on the category). Conversely, 90% of a merchant’s customers are not loyal, on average.
These loyal customers have a share of wallet of 62% (meaning 62% of their category spend is with the merchant). Not loyal customers have a share of wallet of only 9%.
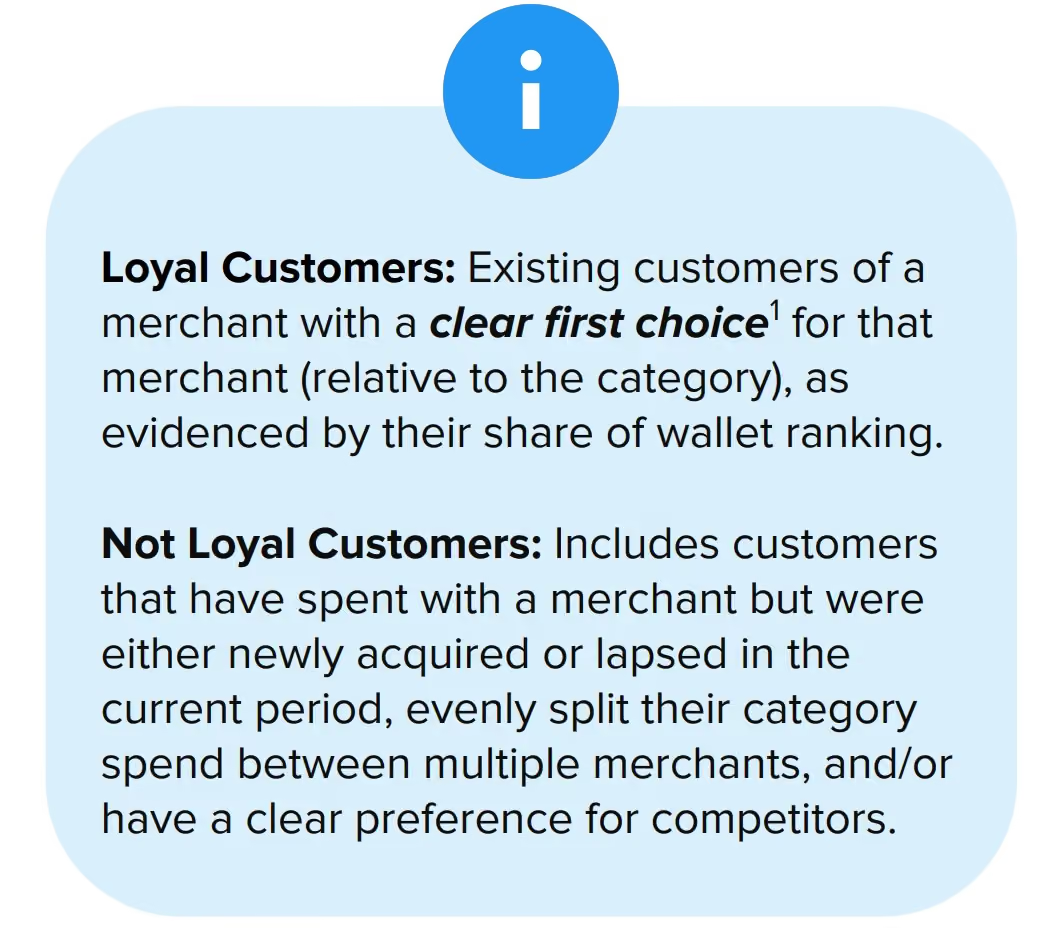
1 Cardlytics applies the principles of the Wallet Allocation Rule to rank existing customers (that spent during the prior and current periods) based on their share of wallet (which is the percentage of a customer’s total spending in a category that goes to a particular merchant) to assess clear first choice based on the relative rank of that merchant. Full methodology included at the end of this report.
Top Customer Loyalty & Share of Wallet
Are Frequent Shoppers Loyal?
In the absence of competitive spend data, Marketers leverage transaction frequency to define loyalty (e.g., “the customers who shop the most frequently are my loyal customers”). Cardlytics isolated the top customers (most frequent purchasers), by merchant, to assess whether this is an appropriate proxy for loyalty. For this group of top customers, we analyzed what percentage of them are loyal (have a clear first choice for the merchant) and how much are they spending with the competition.
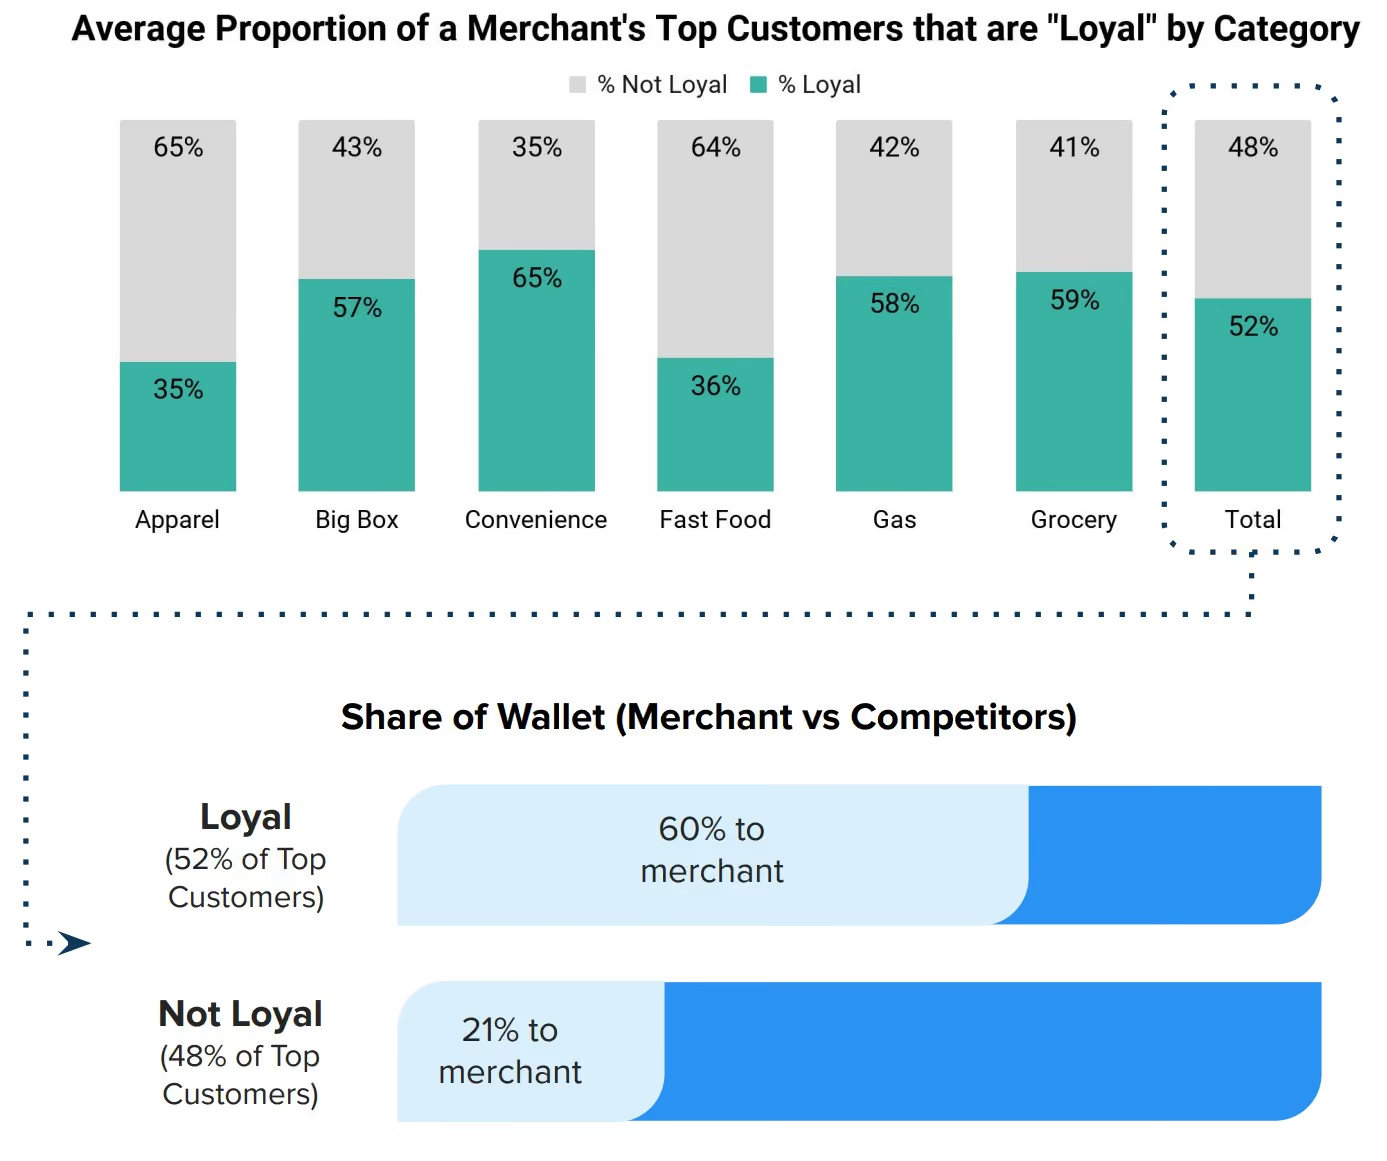
On average, only 52% of a merchant’s top customers are loyal (with a clear first choice for the brand). In other words, roughly half of a brand’s top (most frequent) customers prefer to shop at competitive brands.
While the top customers that are loyal have a share of wallet of 60%, the remaining top-customers have a share of wallet of only 21%, meaning 79% of their spend goes to competitors.
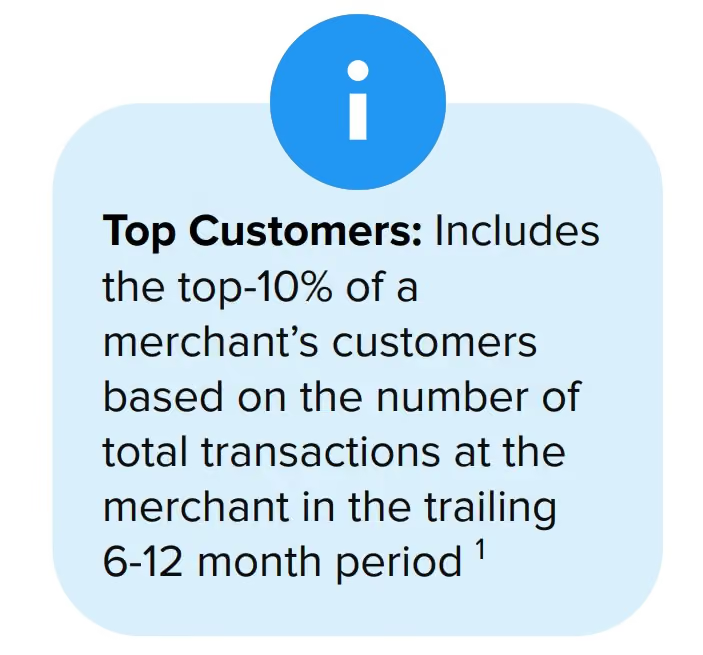
1 Cardlytics used a 12 month measurement period for Apparel and Big Box (08/01/23 to 07/31/24) and a 6 month period for all other categories (01/31/24 to 07/31/24) when isolating the top-10% most frequent shoppers. Cardlytics measured the share of wallet ranking for all of these top customers with spend in this period (regardless of whether they were newly acquired by the brand in the period or if they were existing shoppers from the prior period).
What do these insights mean for you?
Supplementing first party transaction data with category-level spending behavior is essential to understanding and defining which customers are loyal (and which customers are not), thereby enabling more informed marketing strategies that deliver growth.
Reach out to Cardlytics to get a custom brand-level view of your business’ loyal customers in relation to the category. For more information, please submit a request.
About Cardlytics
Cardlytics is the world's largest bank rewards network, powering offers for more than 20 of the top bank partners globally, including the world’s largest retail brands, representing $4.7T in consumer spend. Cardlytics helps brands determine what loyalty really looks like across their customer base to identify headroom for growth, reach customers deterministically, and drive conversions.
1. Loyal customers are existing customers of a merchant with a clear first choice for that merchant (relative to the category), as evidenced by their share of wallet ranking (note: existing customers are those with spend in the current and prior periods4).
2. Includes customers that have spent with a merchant but were either newly acquired or lapsed in the current period4, evenly split their category spend between multiple merchants, and/or have a clear preference for competitors.
3. Includes the top-10% of a merchant’s customers based on the number of transactions at the merchant in the trailing 6-12 month period
4. Current period for Apparel and Big Box is 08/01/23 to 07/31/24; current period for all other categories is 01/31/24 to 07/31/24

UK State of Loyalty Spend 2024
The State of Loyalty Spend report, based on the spending habits of over 22 million UK bank accounts, along with a poll of 2,000 UK adults conducted by Opinium assessing customer loyalty, found that - despite consumers being increasingly cost-conscious - there is still room for brand loyalty to influence spending behaviour.
A Lens on Loyalty: Cardlytics UK State of Spend Report 2024
LONDON, UNITED KINGDOM - 30 JULY 2024: Despite the cost-of-living crisis easing, it continues to play a significant role in shifting consumer behaviour, forcing brands to reconsider how they can inspire loyalty in an environment where consumers are looking to reduce their outgoings, according to a new report from advertising platform Cardlytics.
The State of Loyalty Spend report, based on the spending habits of over 22 million UK bank accounts, along with a poll of 2,000 UK adults conducted by Opinium assessing customer loyalty, found that - despite consumers being increasingly cost-conscious - there is still room for brand loyalty to influence spending behaviour.
Seven in 10 (69%) UK adults view trust in a brand as important to them when making a purchase, whilst three fifths (59%) say that they have been loyal to brands for “as long as they can remember” - a clear indication that brand loyalty is well and truly alive. However, particularly off the back of the cost-of-living crisis, affordability is vital in shaping and influencing purchasing habits. UK adults rank price as the most important factor in the decision-making process, followed by trust in a brand and convenience.
This report examines three specific categories - retail, hospitality and travel - which together demonstrate a clear trend of customers having to balance commitment to the brands they know and love, with limiting financial outgoings. With consumer behaviour in flux, the report includes analysis on some of the factors creating this environment, along with recommendations for business leaders on how they can inspire brand loyalty, whilst also attracting to new customers.
UK restaurant-goers have a greater appetite for what they know
The dining sector is, generally, one of the first areas of discretionary spend that consumers cut when times are tough. With overall spending in restaurants down 8% in 2024 (following a 14% rise in 2023) but spending per trip up by almost a fifth (16%), it’s clear to see the challenges that brands and consumers face in the current environment. Price remains the key driver for customers when it comes to eating out, but other factors, including loyalty, quality, and trust remain relevant.
Over half (54%) of adults choose to return to restaurants they have visited before over trying new alternatives, showing that consumers remain risk averse as economic pressures on households continue to build. Despite this, a similar number (54%) of consumers are more likely to visit a new restaurant if they offer a discount voucher or cash back rewards system; while 45% of UK households are more likely to visit a restaurant if it offers rewards for returning customers. This is evidence of the potential for data-driven tactics to enable restaurants to drive greater footfall and sustain their existing customer base.
Affordability trumps loyalty when it comes to the weekly food shop
Two-thirds (64%) of respondents named affordability as the most important factor when deciding where to shop, a clear indication of impact of record levels of inflation on consumers’ disposable income.
Despite consumers being increasingly cost-conscious, three in five (61%) said they are more likely to visit a store or supermarket if it offers a loyalty or rewards system – rising to 70% for the 18-34 demographic. In an environment where brand loyalty has come under question, this research shows how solutions such as targeted offers and rewards can inspire commitment to brands.
Indeed, loyalty remains an important factor for many consumers, with over half (54%) choosing to travel to shop at their preferred supermarket, even if other options are closer. This should serve as further encouragement for supermarkets that reward their customers for staying faithful, particularly in times where confidence in spending is low.
Holidaymakers balance brand familiarity and cost
When it comes to travel, affordability is key, but building brand loyalty is a clear opportunity - with 69% agreeing that trust in a brand is important when making a purchase. Brands that can unlock insights from their data, and provide tailored offers, will thrive - building greater trust in a time where competition is rife.
Over the last two years, budget airlines have seen a boom, with the total number of trips increasing from 1,750,000 in 2022 to 2,400,000 in the first six months of 2024 (already a 37% rise), whilst non-budget airlines have only increased from 509,000 to 590,000 (a 15% uplift) across the same period.
Equally, the volume of domestic travel has doubled between 2021 and 2024. Whilst this could be down to more people recognising the beauty of the Cornish coast or Yorkshire Dales, affordability is likely to be a key factor driving this uplift. The average transaction value of a domestic holiday (£110) is £20 cheaper than a budget airline flight (without the additional expense of accommodation), less than a third of the price of a non-budget airline, and almost a fifth of the price of a package holiday abroad.
“Whilst affordability will always be key for consumers, particularly in tough economic times for consumers and households, building brand loyalty is key. Whether it’s restaurant-goers sticking with what they know, particularly when they’re rewarded for it, or customers travelling further than they need to take advantage of their favourite supermarket’s loyalty card system, consumers are making savvy decisions based on what suits them – and often, which brands treats them best," Lucy Whittemore, SVP of UK Advertising, Cardlytics states.
"For businesses in hospitality, retail, and travel, where competition is high and interaction with customers is frequent, data will be key. By gleaning insights from customers’ spending data, brands can create, tailored, relevant offers for consumers – both new and existing. This can help them build a deeper connection with the customer, fostering loyalty and trust to drive footfall and incremental growth in spend.”
The full State of Spend Report is available for download here.
Methodology
Cardlytics analysed spending trends based on its purchase intelligence data, which covers over 22 million UK bank accounts. The periods include January and February spending from the last four years (2024, 2023, 2022, 2021).
Cardlytics also conducted research with Opinium looking at customer loyalty. The omnibus surveyed 2,000 UK adults, nationally representative, between 18th and 21st June 2024.

Insight: Unleashing Potential from Pet Parents
Our 1st party transaction data suggests that while less and less consumers are spending in the pet specialty retail category every year, those who remain are increasingly valuable for brands to retain.
Explore why driving transaction frequency among existing and high-value customers is essential in the pet category.
New from Cardlytics: Our 1st party transaction data suggests that while less and less consumers are spending in the pet specialty retail category every year, those who remain are increasingly valuable for brands to retain. Download the full insight bulletin today!
Since COVID, the Pet specialty retail category has seen impressive growth in spend every year. However, the rate of growth has significantly declined. The leading driver of this slow down is a decline in the volume of Pet shoppers - shopper volume only grew by 1.17% in 2023. There are less category shoppers overall, and less consumers defined as new pet parents.*
Despite fewer shoppers entering the category, existing pet parents are doting on their pets with non-essential purchases.
Of existing pet parents shopping the category in 2023, 9% were considered “doting pet parents” (+2pts vs. 2022) who make non-essential purchases for their pets (e.g. premium natural food). This category of shoppers spends 2x more than the average pet parent.
What does this mean for you?
Driving transaction frequency among existing and high-value customers is essential to increasing sales long-term, especially when the category competition is fierce.
Download the full insight bulletin, and let’s chat about how Cardlytics can help drive your pet loyalty efforts. Email hello@cardlytics.com to get started.

Marketers, Adapt! (And Keep Your Best Customers)
The pandemic forced brands to innovate at lightning speed. Consumer trends expected to manifest in years, were compressed into months or even weeks, as shoppers dramatically shifted preference to convenience and online options. Everything from grocery shopping to fitness to entertainment moved online and disruptive direct-to-consumer (DTC) brands reaped the rewards. The big question is, "How did that affect customer loyalty?"
As the country gears up for its grand re-opening, we’re seeing a sizeable, and we believe permanent, change in how people shop.
Consumers are taking their money elsewhere.
The pandemic dramatically affected businesses of all types, but its impact felt very different depending on the business model. Cardlytics’ data shows, before lockdowns began in 2020, 8% of consumer spend could be attributed to DTC brands. That share has jumped to 14% from March 2020 to March 2021.
Rural shoppers are spending as much as their urban counterparts.
Consider this: spend on DTC brands in rural areas now matches the spend patterns of our urban centers pre-COVID.

The rural in-store shopping experience isn’t known to be rich with options. The added layer of lockdowns during the pandemic further limited entry to traditional brick and mortar retailers and gave rise to DTC brands in rural areas. While the option to buy online isn’t necessarily new, the habits of these shoppers have changed far more rapidly than expected.

There is an urgent call to action for both traditional business as well as DTC. For the traditional business, hoping things revert to “normal” is no longer a viable strategy.
The Bottom Line:
Meet the customer’s needs on their terms, it’s more important than ever. Keep an eye out for changes in purchase behavior and consider the following questions:
- Are the number of retailers in a given category that have a share of the wallet increasing or decreasing?
- How are baskets changing value, frequency, timing of purchase, and channel of purchase, especially online vs. in-store?
- What are the changes in the channels of influence when looking at incremental return channel by channel?

Remember to:
- Re-assess customer loyalty and look at share of wallet for the category rather than simply frequency or amount of spend with their store alone.
- Focus on retention. Considering all the new customer growth, DTC brands must know if they’ve kept pace with competitor growth rather than benchmarking against their own revenue.
- Understand the point of true loyalty. A customer with only one purchase is more likely to be a trialist at risk of churn.
Thanks to the pandemic-led focus on health, safety and social distancing it was easy to bring customers in, but it’s vital that they don’t fall off and revert to old spending habits.
Get our insights delivered to you
Stay up to date. Subscribe now.